US Polyester Staple Fiber Trade Remedies: Complete Guide — Anti-Dumping, Safeguard and Exporter Guide (2024–2025 Update)
The United States polyester staple fiber market is subject to multiple overlapping trade remedy measures — anti-dumping and countervailing duty orders, five-year sunset reviews, and now a global safeguard action resolved in November 2024. For any exporter supplying PSF to the US, or any US buyer sourcing PSF internationally, understanding these measures with precision is a commercial and legal compliance requirement.
This guide provides the complete, verified picture of all active US trade remedies affecting polyester staple fiber imports as of April 2025 — the three trade remedy instruments, the specific PSF measures and their status, the landmark November 2024 Presidential Proclamation 10857 and its precise scope, the product inclusions and exclusions that determine what is affected, and the practical implications by product type and country. All facts are sourced from official USITC, Federal Register, White House, and CBP documentation.
Last updated April 2025. Trade remedy measures are subject to review and modification. Verify current status with USITC (usitc.gov) and CBP (cbp.gov) before commercial decisions. This guide is informational — not legal advice. Consult a licensed US customs attorney for compliance decisions.
The Three US Trade Remedy Instruments
| Instrument | Legal Basis | How It Works |
| Anti-Dumping (AD) | Section 731, Tariff Act 1930 | Applies when foreign exporters sell in the US below home-market price or below cost of production. The dumping margin becomes an additional percentage duty on imports from specific exporters in specific countries. Both USITC (injury) and Commerce (dumping margin) must make affirmative determinations. |
| Countervailing Duty (CVD) | Section 701, Tariff Act 1930 | Applies when foreign governments subsidize their industries (export subsidies, preferential loans, tax benefits) giving them an unfair cost advantage. CVD rate offsets the subsidy benefit. Both USITC (injury) and Commerce (subsidy rate) required. |
| Global Safeguard (Sec. 201) | Sections 201-203, Trade Act 1974 | Applies when imports from all countries increase to cause or threaten serious injury to domestic industry — regardless of pricing or subsidies. Standard: ‘substantial cause of serious injury’ — lower than AD/CVD. President determines remedy (tariff, quota, TRQ). Maximum 4 years initial, extendable to 8 years total. |
Background: Existing AD/CVD Orders on Fine Denier PSF
Long before the 2024 safeguard case, the US had maintained anti-dumping and/or countervailing duty orders on fine denier PSF from four countries — a legacy of prior investigations finding unfair trade practices:
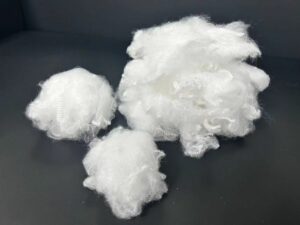
- Product scope of AD/CVD orders: Fine denier PSF measuring less than 3.3 decitex (3 denier) in diameter, not carded or combed. HTS: 5503.20.0025. Standard PSF at 3D and above is NOT covered.
- Countries covered: China (AD + CVD orders), India (AD order), South Korea (AD order), Taiwan (AD order). Vietnam has NO pre-existing AD/CVD orders on PSF.
2023 Five-Year Sunset Reviews — Result: All Orders Continued
In March 2024, the USITC determined that revoking the AD/CVD orders on fine denier PSF from China, India, South Korea, and Taiwan would likely lead to continuation or recurrence of material injury to US industry. All four orders were therefore continued — they remain in force alongside the 2024 safeguard measure.
| Country | Orders | Status April 2025 |
| China | AD + CVD | Both continued (2023 sunset review). AD rates by exporter; CVD rates for subsidies. Additionally subject to Section 301 tariffs (~24.3% effective March 2025) on top of AD/CVD. |
| India | AD only | AD order continued. CVD order was revoked in an earlier review. |
| South Korea | AD only | AD order continued. |
| Taiwan | AD only | AD order continued. |
| Vietnam | None | No pre-existing AD/CVD orders on PSF. Subject to 2024 global safeguard (TIB-specific) as a non-excluded country. |
| All others — Standard PSF ≥3D | None | Standard PSF 3 denier and above is excluded from all AD/CVD orders and the safeguard. Normal MFN duties only. |
The 2024 Global Safeguard Case: Complete Timeline
The most significant recent development is the 2024 Section 201 global safeguard investigation — the first safeguard case involving PSF — and its resolution in November 2024. This case is directly relevant to all exporters from Vietnam and other countries without existing AD/CVD exposure.
Petition Filed — February 28, 2024
Three US manufacturers filed a Section 201 petition with the USITC: Fiber Industries LLC d/b/a Darling Fibers (Darlington, SC), Nan Ya Plastics Corporation America (Lake City, SC), and Sun Fiber LLC (Richburg, SC). They alleged that sharply increased fine denier PSF imports (2021–2023) were a substantial cause of serious injury to the domestic industry. Product covered: all fine denier PSF below 3.3 decitex (3D), any coating, color, length, or raw material (virgin or recycled). Investigation No. TA-201-078.
Key Milestones: February to November 2024
| Date | Event |
| March 13, 2024 | USITC publishes notice in Federal Register. Investigation designated ‘extraordinarily complicated’ — 150-day injury determination period. |
| July 9, 2024 | USITC votes 4-0 AFFIRMATIVE injury determination. Fine denier PSF imports are a substantial cause of serious injury to the US domestic industry. Unanimous: Commissioners Karpel, Johanson, Schmidtlein, Kearns. |
| August 13, 2024 | USITC issues remedy recommendations. All four Commissioners recommend: (1) four-year period of relief; (2) tariff-rate quota (TRQ) on all fine denier PSF imports; and (3) quantitative restriction (QR) at zero in Year 1 on TIB entries, increasing by 1 million pounds per year in Years 2-4. |
| August 26, 2024 | USITC transmits full report to President (Inv. No. TA-201-78, USITC Publication 5536, August 2024). |
| September 30, 2024 | USTR public hearing on appropriateness of safeguard remedy. Downstream manufacturers — including nonwoven producers — argue strongly against broad TRQ. |
| November 8, 2024 | President Biden signs Presidential Proclamation 10857. Published Federal Register November 14, 2024 (FR Doc. 2024-26714). Effective November 23, 2024. |
Presidential Proclamation 10857: What Was Actually Decided
The President did NOT impose the tariff-rate quota (TRQ) that all four USITC Commissioners recommended. The President instead tailored the remedy exclusively to Temporary Importation under Bond (TIB) entries. Standard commercial imports of fine denier PSF are NOT restricted by this proclamation. This is the single most commercially important fact about this safeguard.
The Proclamation’s stated rationale for rejecting the TRQ: ‘balancing the competing interests of domestic fine denier PSF manufacturers and the impact of the safeguard remedy on downstream United States producers, including manufacturers of textiles, defense products, and consumer products, that rely on fine denier PSF.’ The Nonwovens Industry’s active participation in the public comment process directly influenced this outcome.
| Element | Precise Detail — Proclamation 10857 |
| Signed / effective | Signed November 8, 2024. Published Federal Register November 14, 2024 (FR Doc. 2024-26714). Effective November 23, 2024. |
| Duration | 4 years: November 23, 2024 through approximately November 22, 2028. |
| Remedy type | Quantitative restriction (absolute quota) on TIB entries ONLY. NOT a tariff. NOT a tariff-rate quota on standard commercial imports. |
| What TIB means | Temporary Importation under Bond — a CBP program allowing goods to enter duty-free temporarily for processing and re-export. Used primarily in apparel manufacturing. NOT used by nonwoven manufacturers. |
| Year 1 TIB quota (to Nov 22, 2025) | ZERO pounds. No fine denier PSF may enter under TIB. (Consistent with historical baseline: no TIB entries of fine denier PSF occurred 2018-2020.) |
| Year 2 TIB quota (Nov 2025–Nov 2026) | 1 million pounds (~454 metric tonnes). First-come, first-served via CBP ACE system. |
| Year 3 TIB quota (Nov 2026–Nov 2027) | 2 million pounds (~907 metric tonnes). |
| Year 4 TIB quota (Nov 2027–Nov 2028) | 3 million pounds (~1,361 metric tonnes). |
| HTS entry sequence for TIB | Use in this order: 9813.00.0520 → 9903.55.01 → 5503.20.0025. See CBP Quota Bulletins QB 25-412 (Year 1) and QB 25-412 (Year 2). |
| Country exclusions (fully exempt) | Canada, Mexico, Australia, CAFTA-DR countries (Costa Rica, Dominican Republic, El Salvador, Guatemala, Honduras, Nicaragua), Colombia, Israel, Panama, Peru, Singapore. Also exempt: developing countries individually below 3% of US fine denier PSF import share (collectively ≤9%). |
| Explicitly excluded products | (1) PSF ≥ 3.3 decitex (3 denier and above) — entirely outside scope. (2) Low-melt polyester staple fiber (bicomponent: polyester core + lower-melting polyester sheath) — explicitly excluded by product definition. |
Complete Scope and Exclusion Table — What Is and Is Not Affected
| Product / Situation | Status | Notes |
| Standard commercial import of fine denier PSF (<3D), any non-excluded country | ✅ FREE — no restriction | Safeguard applies ONLY to TIB entries. Normal commercial imports unrestricted. |
| Fine denier PSF (<3D) under TIB, Year 1 (to Nov 22, 2025) | ❌ ZERO quota | No TIB entries permitted at all in Year 1. |
| Fine denier PSF (<3D) under TIB, Year 2 (Nov 2025–Nov 2026) | ⚠️ 1M lb quota | First-come, first-served. First available TIB allocation since proclamation. |
| Fine denier PSF (<3D) under TIB, Years 3 and 4 | ⚠️ 2M / 3M lb | Graduated increase each year through November 2028. |
| Standard PSF at 3 denier or greater (any country) | ✅ FREE — no restriction | Explicitly excluded from scope. Covers 3D, 4D, 6D, 7D, 10D and all coarser grades. |
| Low-melt fiber (LMF/bico — polyester core, lower-melt sheath) | ✅ FREE — no restriction | Explicitly excluded from scope by Proclamation 10857 product definition. |
| Fine denier PSF from FTA-excluded countries (Canada, Mexico, Australia, CAFTA-DR, Colombia, Israel, Panama, Peru, Singapore) | ✅ FREE — no restriction | These FTA partner countries are exempt from the safeguard. |
| Fine denier PSF from developing countries with <3% US import share | ✅ FREE — no restriction | Developing countries each below 3% threshold individually exempt. |
| Fine denier PSF from China — any entry type | ⚠️ AD/CVD + Sec. 301 | Subject to pre-existing AD/CVD orders PLUS Section 301 tariffs (~24.3% effective March 4, 2025). No additional safeguard duty on non-TIB commercial entry under Proclamation 10857. |
| GRS-certified recycled fine denier PSF (<3D) | Same as virgin — scope covers ‘all fine denier PSF regardless of material inputs’ | Safeguard scope explicitly includes both virgin and post-consumer recycled fine denier PSF. |
Vietnam Specifically
Vietnam was included in the USITC global safeguard investigation as one of the major exporters of fine denier PSF to the US. In 2023, Vietnam’s exports of fine denier PSF to the US totalled approximately USD 5.2 million — ranking 8th among exporting countries at approximately 3% of total US fine denier PSF imports.
Vietnam is not a beneficiary of any of the country exclusions in Presidential Proclamation 10857 — Vietnam has no free trade agreement with the US and is not in the CAFTA-DR group. However, Vietnam’s practical exposure is limited to the TIB-only scope:
- Standard commercial exports of fine denier PSF from Vietnam to the US: NOT restricted. Normal commercial import entry is unaffected by this proclamation.
- Fine denier PSF from Vietnam under TIB: Subject to restriction — zero in Year 1 (to November 2025); graduated increases in Years 2-4.
- Standard PSF (3 denier and above) from Vietnam: Completely unaffected. No trade remedy measures apply. Normal MFN duties only.
VNPOLYFIBER’s standard product range — HCS siliconized fiber in 3D, 4D, 6D, 7D and above — is at 3 denier or above and is therefore entirely excluded from the safeguard scope. Our core products can continue to be exported to the US market without any restriction from this measure.
HTS Classification Reference
| HTS Number | Product | Trade Remedy Status |
| 5503.20.0025 | PSF, not carded/combed, <3.3 decitex (fine denier) | AD/CVD orders: China, India, South Korea, Taiwan. TIB-specific safeguard: all non-excluded countries. Normal commercial import: standard MFN duty. |
| 5503.20.0045 | PSF, not carded/combed, ≥3.3 to <13.2 decitex | No AD/CVD orders. Not covered by safeguard. MFN duty ~4.3%. |
| 5503.20.0065 | PSF, not carded/combed, ≥13.2 decitex | No AD/CVD orders. Not covered by safeguard. MFN duty ~4.3%. |
| 9813.00.0520 | TIB entry subheading | Used in TIB entry sequence: 9813.00.0520 → 9903.55.01 → 5503.20.0025. |
| 9903.55.01 | Safeguard measure subheading | Added by Proclamation 10857 for fine denier PSF TIB entries only. |
Key Dates to Monitor
| Date | Development |
| November 23, 2025 | Year 1 TIB quota ends. Year 2 opens: 1 million pounds total for all covered countries. First available TIB allocation. |
| November 23, 2026 | Year 3 opens: 2 million pounds TIB quota. |
| November 23, 2027 | Year 4 opens: 3 million pounds TIB quota. |
| November 22, 2028 | Safeguard scheduled to terminate unless extended. Extension requires new USITC investigation. |
| 2025 onwards | Section 301 tariff rates on Chinese goods may be further modified. Monitor Federal Register for China tariff list changes. |
| ~2028-2029 | Next five-year sunset reviews for AD/CVD orders on fine denier PSF from China, India, South Korea, Taiwan. Orders could be terminated if USITC/Commerce make negative findings. |
Conclusion
Presidential Proclamation 10857 represents the final resolution of the 2024 fine denier PSF safeguard case — and its practical commercial impact is deliberately limited by the President’s decision to target TIB entries only, explicitly protecting downstream nonwoven and textile manufacturers who depend on fine denier PSF imports. For exporters of standard PSF at 3 denier and above, LMF/bico fiber, and all products excluded from the safeguard scope, the US market remains fully accessible under normal trade conditions.
The critical distinctions to keep in mind: fine denier PSF below 3D under TIB is restricted; standard commercial import of fine denier PSF is not; all PSF at 3D and above is entirely outside the safeguard scope; and LMF is explicitly excluded. These precise scope boundaries determine which products are commercially affected and which are not.
VNPOLYFIBER will continue monitoring US trade remedy developments — including any potential modification of this safeguard, Section 301 tariff changes on Chinese PSF, and upcoming AD/CVD sunset reviews — and will update this guide as material developments occur. Contact us for specific guidance on your product’s trade remedy status when shipping to the US market.