
Top 10 tallest buildings in Vietnam – Updated 2024
The 10th tallest building in Vietnam – HPC Landmark 105
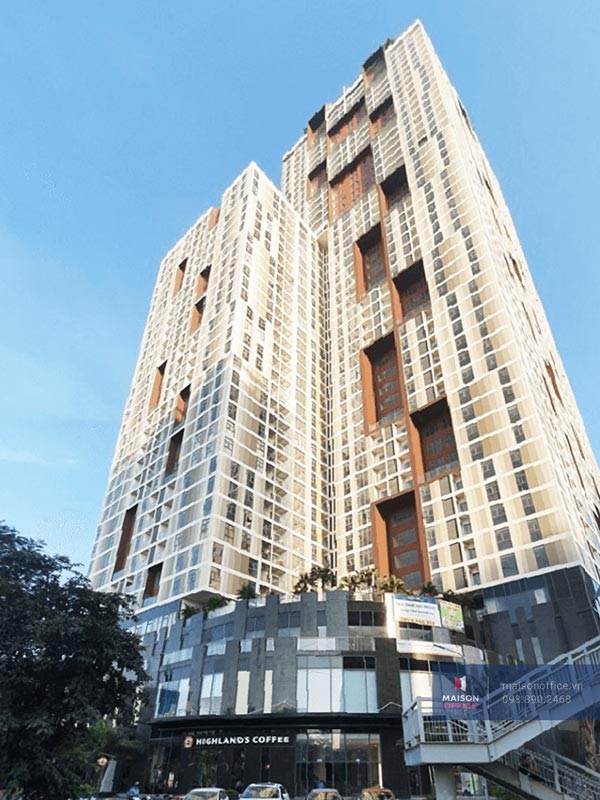
- Location: Hanoi
- Height: 190m
- Year of completion: 2018
- Scale: 50 floors
- Investor: Hai Phat Capital Investment Joint Stock Company
The 9th tallest building in Vietnam – Saigon Centre 2
- Location: Ho Chi Minh City. HCM
- Height: 193.7m
- Year of completion: 2017
- Scale: 42 floors
- Investor: Keppel Land
The 8th tallest building in Vietnam – Discovery Complex A
- Location: Hanoi
- Height: 195m
- Year of completion: 2018
- Scale: 54 floors
- Investor: Cau Giay Trading and Service Investment Joint Stock Company (Member of Kinh Do TCI Group)
The 7th tallest building in Vietnam – Saigon One Tower
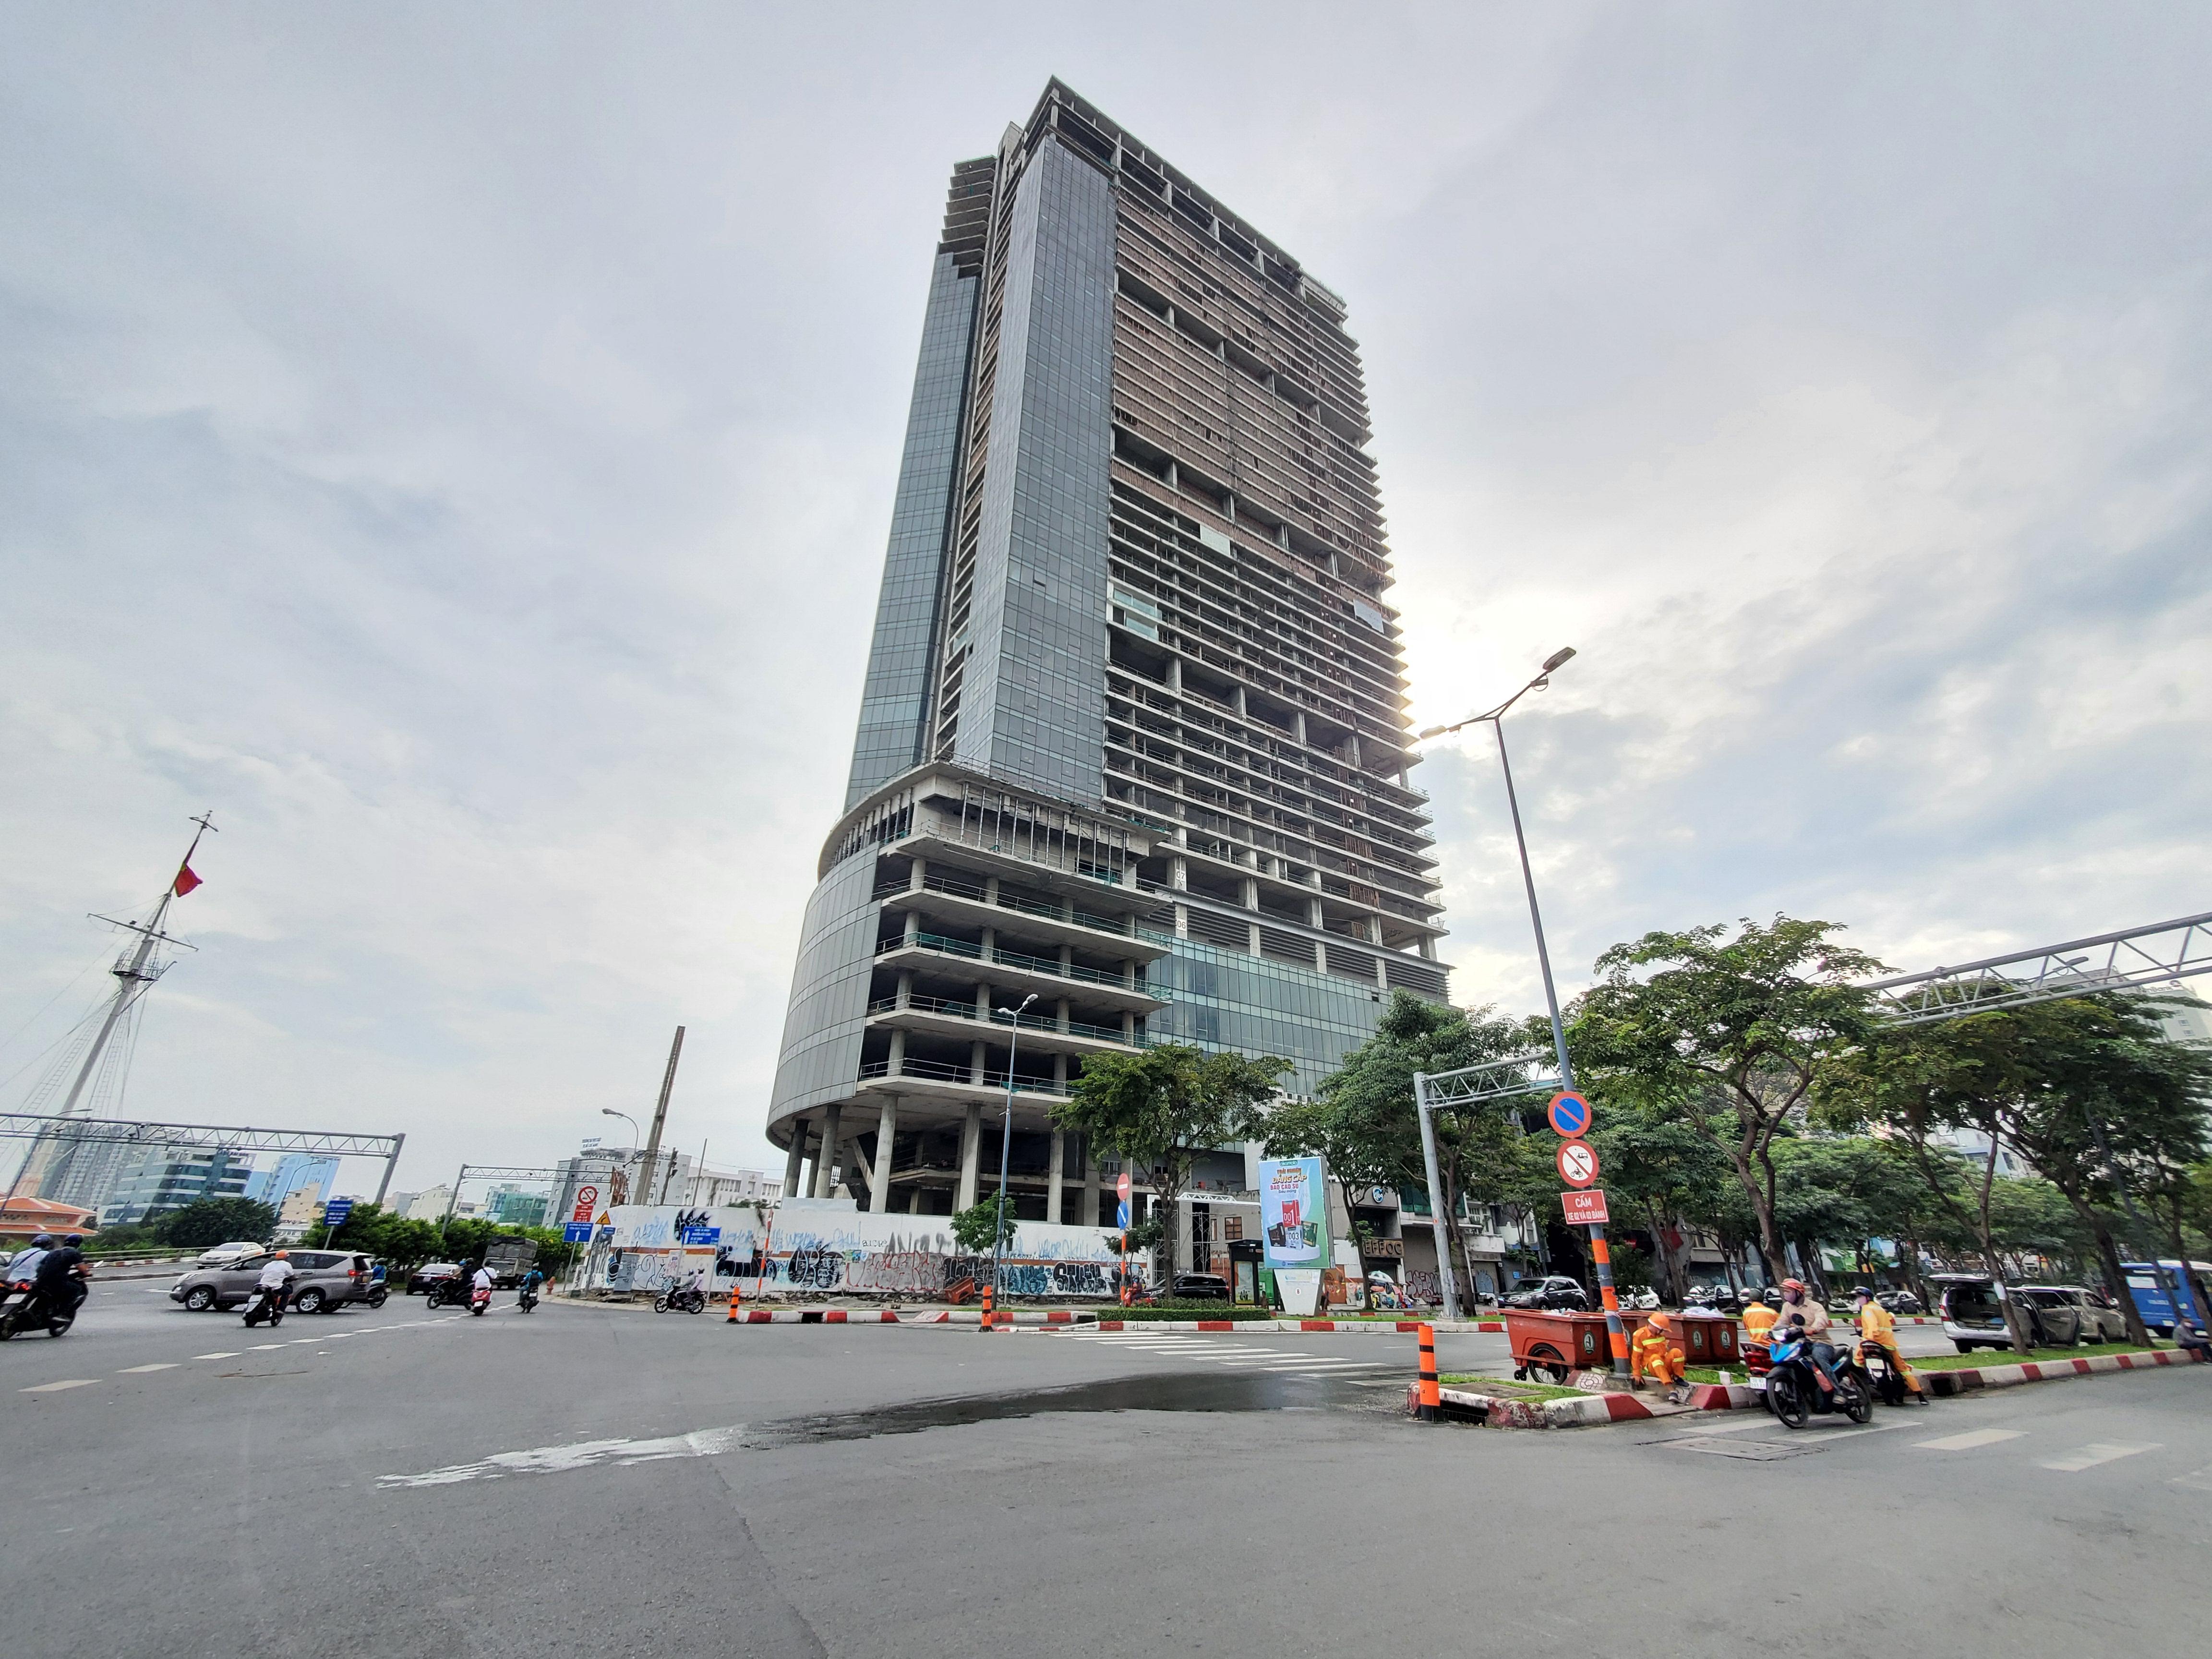
- Location: Ho Chi Minh City. HCM
- Height: 195.3m
- Year of completion: Suspension of construction
- Scale: 42 floors
- Investor: Updating
The 6th tallest building in Vietnam – Vietcombank Tower
- Location: Ho Chi Minh City. HCM
- Height: 206m
- Year of completion: 2015
- Scale: 35 floors
- Investor: Vietcombank – Banday – Benthanh Joint Venture
The 5th tallest building in Vietnam – Keangnam Landmark Tower A, B

- Location: Hanoi
- Height: 212m
- Year of completion: 2011
- Scale: 48 floors
The 4th tallest building in Vietnam – Bitexco Financial Tower

- Location: Ho Chi Minh City. HCM
- Height: 262m
- Year of completion: 2010
- Scale: 68 floors
- Investor: Bitexco Group
The 3rd tallest building in Vietnam – Lotte Center Hanoi

- Location: Hanoi
- Height: 272m
- Year of completion: 2014
- Scale: 65 floors
- Investor: Lotte Group (Korea)
The 2nd tallest building in Vietnam – Keangnam Hanoi Landmark Tower
- Location: Hanoi
- Height: 336m
- Year of completion: 2011
- Scale: 72 floors
- Investor: Keangnam Group (Korea)
The tallest building in Vietnam in 1st place -Vincom Landmark 81

- Location: Ho Chi Minh City. HCM
- Height: 461.2m
- Year of completion: 2018
- Scale: 81 floors
- Investor: Vingroup
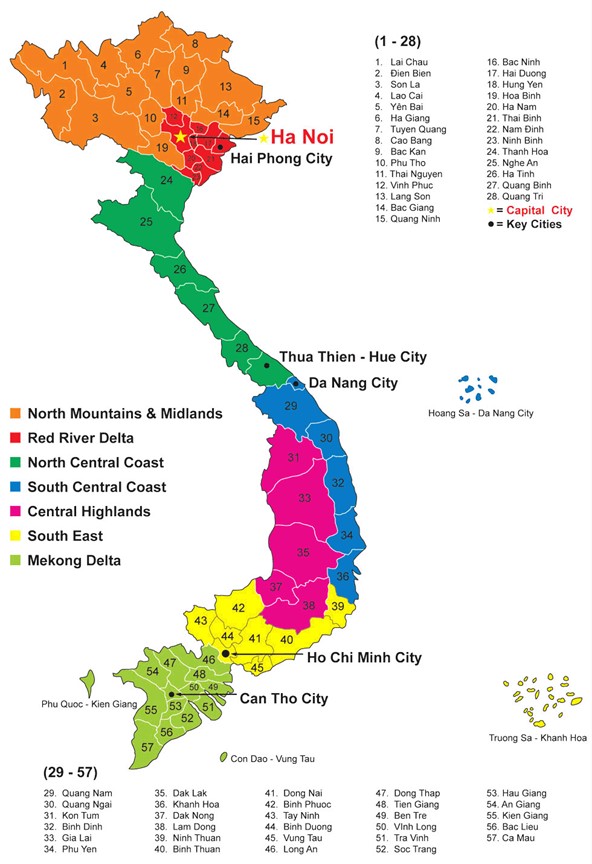
How many regions are there in Vietnam?
| Order Number | Name of province and city | Provincial capital | Area | Population (people) | Area (km²) | Density (persons/km2) | District-level administration |
| 1 | An Giang | Longchuan City | Mekong Delta | 1.908.352 | 3.536,70 | 540 | 11 |
| 2 | Ba Ria – Vung Tau | Ba Ria City | Southeast | 1.148.313 | 1.980,80 | 580 | 8 |
| 3 | Bac Lieu | Bac Lieu City | Mekong Delta | 907.236 | 2.669 | 340 | 7 |
| 4 | Bac Giang | Bac Giang City | Northeast | 1.803.950 | 3.851,40 | 468 | 10 |
| 5 | Bac Kan | Bac Kan City | 313.905 | 4.860 | 65 | 8 | |
| 6 | Bac Ninh | Bac Ninh City | Red River Delta | 1.368.840 | 822,7 | 1.664 | 8 |
| 7 | Ben Tre | Ben Tre City | Mekong Delta | 1.288.463 | 2.394,60 | 538 | 9 |
| 8 | Binh Duong | Thu Dau Mot City | Southeast | 2.426.561 | 2.694,70 | 900 | 9 |
| 9 | Binh Dinh | Quy Nhon City | South Central Coast | 1.486.918 | 6.066,20 | 245 | 11 |
| 10 | Binh Phuoc | Dong Xoai City | Southeast | 994.679 | 6.877 | 145 | 11 |
| 11 | Binh Thuan | Phan Thiet City | South Central Coast | 1.230.808 | 7.812,80 | 158 | 10 |
| 12 | Ca Mau | Ca Mau City | Mekong Delta | 1.194.476 | 5.294,80 | 226 | 9 |
| 13 | Cao Bang | Cao Bang City | Northeast | 530.341 | 6.700,30 | 79 | 10 |
| 14 | Can Tho | Ninh Kieu District | Mekong Delta | 1.235.171 | 1.439,20 | 858 | 9 |
| 15 | Danang | Hai Chau District | South Central Coast | 1.134.310 | 1.284,90 | 883 | 8 |
| 16 | Dak Lak | Buon Ma Thuot City | Central Highlands | 1.869.322 | 13.030,50 | 143 | 15 |
| 17 | Dak Nong | Chiayi City | 622.168 | 6.509,30 | 96 | 8 | |
| 18 | Dien Bien | Dien Bien Phu City | Northwest | 598.856 | 9.541 | 63 | 10 |
| 19 | Dong Nai | Bien Hoa City | Southeast | 3.097.107 | 5.905,70 | 524 | 11 |
| 20 | Dong Thap | Cao Lanh City | Mekong Delta | 1.599.504 | 3.383,80 | 473 | 12 |
| 21 | Gia Lai | Pleiku City | Central Highlands | 1.513.847 | 15.510,80 | 98 | 17 |
| 22 | Ha Giang | Ha Giang City | Northeast | 854.679 | 7.929,50 | 108 | 11 |
| 23 | Henan | Phu Ly City | Red River Delta | 852.800 | 860,9 | 991 | 6 |
| 24 | Hanoi | Hoan Kiem District | 8.053.663 | 3.358,90 | 2.398 | 30 | |
| 25 | Ha Tinh | Ha Tinh City | North Central Vietnam | 1.288.866 | 5.990,70 | 215 | 13 |
| 26 | Hai Duong | Hai Duong City | Red River Delta | 1.892.254 | 1.668,20 | 1.135 | 12 |
| 27 | Hai Phong | Hong Bang District | 2.028.514 | 1.522,50 | 1.332 | 15 | |
| 28 | Hau Giang | Viqing City | Mekong Delta | 733.017 | 1.621,80 | 452 | 8 |
| 29 | Peace | Hoa Binh City | Northwest | 854.131 | 4.591 | 186 | 10 |
| 30 | Ho Chi Minh City | District 1 | Southeast | 8.993.082 | 2.061 | 4.363 | 22 |
| 31 | Hung Yen | Hung Yen City | Red River Delta | 1.252.731 | 930,2 | 1.347 | 10 |
| 32 | Khanh Hoa | Nha Trang City | South Central Coast | 1.231.107 | 5.137,80 | 240 | 9 |
| 33 | Kien Giang | Rach Gia City | Mekong Delta | 1.723.067 | 6.348,80 | 271 | 15 |
| 34 | Kon Tum | Kon Tum City | Central Highlands | 540.438 | 9.674,20 | 56 | 10 |
| 35 | Lai Chau | Lai Chau City | Northwest | 460.196 | 9.068,80 | 51 | 8 |
| 36 | Lang Son | Lang Son City | Northeast | 781.655 | 8.310,20 | 94 | 11 |
| 37 | Lao Cai | Lao Cai City | Northwest | 730.420 | 6.364 | 115 | 9 |
| 38 | Lam Dong | Da Lat City | Central Highlands | 1.296.606 | 9.783,20 | 133 | 12 |
| 39 | Long An | Tan An City | Mekong Delta | 1.688.547 | 4.490,20 | 376 | 15 |
| 40 | Nam Dinh | Nam Dinh City | Red River Delta | 1.780.393 | 1.668 | 1.067 | 10 |
| 41 | Nghe An | Vinh City | North Central Vietnam | 3.327.791 | 16.493,70 | 202 | 21 |
| 42 | Ninh Binh | Ninh Binh City | Red River Delta | 982.487 | 1.387 | 708 | 8 |
| 43 | Ninh Thuan | Phan Rang City – Thap Cham | South Central Coast | 590.467 | 3.355,30 | 176 | 7 |
| 44 | Phu Tho | Viet Tri City | Northeast | 1.463.726 | 3.534,60 | 414 | 13 |
| 45 | Phu Yen | Tuy Hoa City | South Central Coast | 961.152 | 5.023,40 | 191 | 9 |
| 46 | Quang Binh | Dong Hoi City | North Central Vietnam | 895.430 | 8.065,30 | 111 | 8 |
| 47 | Quang Nam | Tam Ky City | South Central Coast | 1.495.812 | 10.574,70 | 141 | 18 |
| 48 | Quang Ngai | Quang Ngai City | 1.231.697 | 5.135,20 | 240 | 13 | |
| 49 | Quang Ninh | Halong City | Northeast | 1.320.324 | 6.177,70 | 214 | 13 |
| 50 | Quang Tri | Dong Ha City | North Central Vietnam | 632.375 | 4.739,80 | 133 | 10 |
| 51 | Soc Trang | Soc Trang City | Mekong Delta | 1.199.653 | 3.311,80 | 362 | 11 |
| 52 | Son La | Son La City | Northwest | 1.248.415 | 14.123,50 | 88 | 12 |
| 53 | Tay Ninh | Tay Ninh City | Southeast | 1.169.165 | 4.041,40 | 289 | 9 |
| 54 | Peace | Thai Binh City | Red River Delta | 1.860.447 | 1.570,50 | 1.185 | 8 |
| 55 | Thai Nguyen | Thai Nguyen City | Northeast | 1.286.751 | 3.536,40 | 364 | 9 |
| 56 | Thanh Hoa | Thanh Hoa City | North Central Vietnam | 3.640.128 | 11.114,70 | 328 | 27 |
| 57 | Thua Thien Hue | Hue City | 1.128.620 | 5.048,20 | 224 | 9 | |
| 58 | Tien Giang | My Tho City | Mekong Delta | 1.764.185 | 2.510,50 | 703 | 11 |
| 59 | Tra Vinh | Tra Vinh City | 1.009.168 | 2.358,20 | 428 | 9 | |
| 60 | Tuyen Quang | Tuyen Quang City | Northeast | 784.811 | 5.867,90 | 134 | 7 |
| 61 | Vinh Long | Vinh Long City | Mekong Delta | 1.022.791 | 1.475 | 693 | 8 |
| 62 | Vinh Phuc | Vinh Yen City | Red River Delta | 1.154.154 | 1.235,20 | 934 | 9 |
| 63 | Yen Bai | Yen Bai City | Northwest | 821.030 | 6.887,70 | 119 | 9 |
Overview of the Geographic Regions of Vietnam
| # | Regions | Area (km²) |
| 1 | Central | 150.350,70 |
| 2 | Northern | 116.368,06 |
| 3 | Southern | 64.395,00 |
| # | Subregion | Area (km²) |
| 1 | Central Highlands | 54.508,00 |
| 2 | North Central Vietnam | 51.452,40 |
| 3 | Northeast | 50.767,96 |
| 4 | Northwest | 50.576,00 |
| 5 | South Central Vietnam | 44.390,30 |
| 6 | Mekong Delta | 40.834,40 |
| 7 | Southeast | 23.560,60 |
| 8 | Red River Delta | 15.024,10 |
Northwest Provinces
| # | Name of province or city | Area (km²) |
| 1 | Son La | 14.123,50 |
| 2 | Dien Bien | 9.541,00 |
| 3 | Lai Chau | 9.068,80 |
| 4 | Yen Bai | 6.887,70 |
| 5 | Lao Cai | 6.364,00 |
| 6 | Peace | 4.591,00 |
Northeast Provinces
| # | Name of province or city | Area (km²) |
| 1 | Lang Son | 8.310,20 |
| 2 | Ha Giang | 7.929,50 |
| 3 | Cao Bang | 6.700,30 |
| 4 | Quang Ninh | 6.177,70 |
| 5 | Tuyen Quang | 5.867,90 |
| 6 | Bac Kan | 4.859,96 |
| 7 | Bac Giang | 3.851,40 |
| 8 | Thai Nguyen | 3.536,40 |
| 9 | Phu Tho | 3.534,60 |
Provinces in the Red River Delta
| # | Name of province or city | Area (km²) |
| 1 | Hanoi | 3.358,90 |
| 2 | Hai Duong | 1.668,20 |
| 3 | Nam Dinh | 1.668,00 |
| 4 | Peace | 1.570,50 |
| 5 | Hai Phong | 1.522,50 |
| 6 | Ninh Binh | 1.387,00 |
| 7 | Vinh Phuc | 1.235,20 |
| 8 | Hung Yen | 930,20 |
| 9 | Henan | 860,90 |
| 10 | Bac Ninh | 822,70 |
North Central Provinces
| # | Name of province or city | Area (km²) |
| 1 | Nghe An | 16.493,70 |
| 2 | Thanh Hoa | 11.114,70 |
| 3 | Quang Binh | 8.065,30 |
| 4 | Ha Tinh | 5.990,70 |
| 5 | Thua Thien Hue | 5.048,20 |
| 6 | Quang Tri | 4.739,80 |
South Central Vietnam Provinces
| # | Name of province or city | Area (km²) |
| 1 | Quang Nam | 10.574,70 |
| 2 | Binh Thuan | 7.812,80 |
| 3 | Binh Dinh | 6.066,20 |
| 4 | Khanh Hoa | 5.137,80 |
| 5 | Quang Ngai | 5.135,20 |
| 6 | Phu Yen | 5.023,40 |
| 7 | Ninh Thuan | 3.355,30 |
| 8 | Danang | 1.284,90 |
Provinces in the Central Highlands
| # | Name of province or city | Area (km²) |
| 1 | Gia Lai | 15.510,80 |
| 2 | Dak Lak | 13.030,50 |
| 3 | Lam Dong | 9.783,20 |
| 4 | Kon Tum | 9.674,20 |
| 5 | Dak Nong | 6.509,30 |
Southeast Provinces
The Southeast, also referred to as the East, is one of the two southern regions of Vietnam. This area includes Ho Chi Minh City, governed centrally, and five provinces: Ba Ria – Vung Tau, Binh Duong, Binh Phuoc, Dong Nai, and Tay Ninh.
| # | Name of province or city | Area (km²) |
| 1 | Binh Phuoc | 6.877,00 |
| 2 | Dong Nai | 5.905,70 |
| 3 | Tay Ninh | 4.041,40 |
| 4 | Binh Duong | 2.694,70 |
| 5 | Ho Chi Minh City | 2.061,00 |
| 6 | Ba Ria Vung Tau | 1.980,80 |
Mekong Delta Provinces
| # | Name of province or city | Area (km²) |
| 1 | Kien Giang | 6.348,80 |
| 2 | Ca Mau | 5.294,80 |
| 3 | Long An | 4.490,20 |
| 4 | An Giang | 3.536,70 |
| 5 | Dong Thap | 3.383,80 |
| 6 | Soc Trang | 3.311,80 |
| 7 | Bac Lieu | 2.669,00 |
| 8 | Tien Giang | 2.510,50 |
| 9 | Ben Tre | 2.394,60 |
| 10 | Tra Vinh | 2.358,20 |
| 11 | Hau Giang | 1.621,80 |
| 12 | Vinh Long | 1.475,00 |
| 13 | Can Tho | 1.439,20 |
Comprehensive List of 85 Cities in Vietnam
| STT | Town | Province Region | Area (km2) | Population (people) | Density (person/m2) | Notes |
| 1 | Ba Ria | Ba Ria – Vung Tau Southeast | 91,46 | 205,195 | 2,240 | Grade II cities: 2014 City: 2012 Chinh District: 8 wards, 3 communes |
| 2 | Bac Lieu | Bac Lieu Southwest | 175,50 | 240.045 | 1.434 | Grade II cities: 2014 City: 2010 Number of communes: 8 wards, 3 communes |
| 3 | Bao Loc | Lam Dong Central Highlands | 232,20 | 162.225 | 698 | Grade III cities: 2009 City: 2010 Chinh District: 6 wards, 5 communes |
| 4 | Bac Giang | Bac Giang Northeast | 66,77 | 210.000 | 3.140 | Grade II cities: 2014 City: 2005 Chinh District: 10 wards, 6 communes |
| 5 | Bac Kan | Bac Kan Northeast | 137,00 | 57.800 | 421 | Type III Urbanization: 2012 City: 2015 Chinh District: 8 wards, 2 communes |
| 6 | Bac Ninh | Bac Ninh Plain Northern Vietnam | 82,60 | 213.616 | 2.605 | Grade I urban area: 2017 City: 2006 Chinh District: 16 wards, 3 communes |
| 7 | Ben Tre | Ben Tre Southwest | 71,12 | 257.350 | 3.625 | Grade III cities: 2007 City: 2009 Chinh District: 10 wards, 7 communes |
| 8 | Bien Hoa | Dong Nai Southeast | 264,08 | 1.251.000 | 4.738 | Grade I urban area: 2015 City: 1976 Chinh District: 23 wards, 7 communes |
| 9 | Merchant Ma Thuot | Dak Lak Central Highlands | 377,18 | 502.170 | 1.132 | Grade I urban area: 2010 City: 1995 Chinh District: 13 wards, 8 communes |
| 10 | Ca Mau | Ca Mau Southwest | 250,30 | 315.270 | 1.261 | Grade II cities: 2010 City: 1999 Chinh District: 10 wards, 7 communes |
| 11 | Cam Ranh | Khanh Hoa South Central Vietnam | 316,40 | 125.311 | 396 | Grade III cities: 2009 City: 2010 Chinh District: 9 wards, 6 communes |
| 12 | Cao Bang | Cao Bang Northeast | 107,62 | 84.421 | 789 | Grade III urban area: 2010 City: 2012 Chinh District: 8 wards, 3 communes |
| 13 | Cao Lanh | Dong Thap Southwest | 107,00 | 225.460 | 2.107 | Grade III cities: 2003 City: 2007 Chinh District: 8 wards, 7 communes |
| 14 | Cam Pha | Quang Ninh Northeast | 486,45 | 203.435 | 418 | Grade II cities: 2015 City: 2012 Chinh District: 13 wards, 3 communes |
| 15 | Chau Doc | An Giang Southwest | 105,29 | 161.547 | 1.538 | Grade II cities: 2015 City: 2013 Chinh District: 5 wards, 2 communes |
| 16 | Da Lat | Lam Dong Central Highlands | 394,64 | 230.000 | 583 | Grade I municipalities: 2009City: 1893 Chinh District: 12 wards, 4 communes |
| 17 | Electricity Bien Phu | Dien Bien Northwest | 64,27 | 73.000 | 1.140 | Grade III cities: 2003 City: 2003 Chinh District: 7 wards 2 communes |
| 18 | Dong Ha | Quang Tri North Central Vietnam | 73,06 | 93.800 | 1.273 | Grade III cities: 2005 City: 2009 Main District: 9 wards |
| 19 | Dong Hoi | Quang Binh North Central Vietnam | 155,71 | 160.325 | 1.034 | Grade II cities: 2014 City: 2004 Chinh District: 10 wards, 6 communes |
| 20 | Dong Mango | Binh Phuoc Southeast | 169,60 | 150.052 | 882 | Grade III urban area: 2014 City: 2018 Chinh District: 6 wards, 2 communes |
| 21 | Ha Giang | Ha Giang Northeast | 135,33 | 71.689 | 531 | Grade III cities: 2009 City: 2010 Chinh District: 5 wards, 3 communes |
| 22 | Ha Long | Quang Ninh Northeast | 272,00 | 300.670 | 1.105 | Grade I urban area: 2013 City: 1993 Main District: 20 wards |
| 23 | Ha Tien | Kien Giang Southwest | 100,49 | 81.576 | 815 | Grade III urban area: 2012 City: 2018 Chinh District: 5 wards, 2 communes |
| 24 | Ha Tinh | Ha Tinh North Central Vietnam | 56,54 | 202.062 | 3.608 | Grade III cities: 2006 City: 2007 Chinh District: 10 wards, 6 communes |
| 25 | Hai Duong | Hai Duong Plain Northern Vietnam | 96,68 | 403.893 | 4.207 | Grade II cities: 2009 City: 1997 Chinh District: 17 wards, 4 communes |
| 26 | Peace | Peace Northwest | 133,34 | 189.210 | 1.422 | Grade III cities: 2005 City: 2006 Chinh District: 8 wards, 7 communes |
| 27 | Hoi An | Quang Nam South Central Vietnam | 61,00 | 152.160 | 2.494 | Grade III cities: 2006 City: 2008 Chinh District: 9 wards, 4 communes |
| 28 | Hue | Thua Thien Hue North Central Vietnam | 72,00 | 455.320 | 6.322 | Grade I cities: 2005 City: 1929 Main District: 27 wards |
| 29 | Hung Yen | Hung Yen Plain Northern Vietnam | 73,42 | 156.275 | 2.140 | Grade III cities: 2007 City: 2009 Chinh District: 7 wards, 10 communes |
| 30 | Kon Tum | Kon Tum Central Highlands | 433,00 | 160.724 | 371 | Grade III cities: 2005 City: 2009 Chinh District: 10 wards, 11 communes |
| 31 | Lai Chau
| Lai Chau Northwest | 70,77 | 52.557 | 750 | Grade III urban area: 2013 City: 2013 Chinh District: 5 wards, 2 communes |
| 32 | Lang Son | Lang Son Northeast | 77,70 | 87.278 | 1.133 | Grade III cities: 2000 City: 2002 Chinh District: 5 wards, 3 communes |
| 33 | Lao Cai | Lao Cai Northwest | 229,67 | 175.230 | 765 | Grade II cities: 2014 City: 2004 Chinh District: 12 wards, 5 communes |
| 34 | Long Xuyen
| An Giang Southwest | 106,87 | 382.140 | 3.605 | Grade II cities: 2009 City: 1999 Chinh District: 11 wards, 2 communes |
| 35 | Nail | Quang Ninh Northeast | 519,58 | 125.000 | 240 | Grade II urban area: 2018 City: 2008 Chinh District: 8 wards, 9 communes |
| 36 | My Tho | Tien Giang Southwest | 81,55 | 282.000 | 3.481 | Grade I urban area: 2016 City: 1967 Chinh District: 11 wards, 6 communes |
| 37 | Nam Dinh | Nam Dinh Plain Northern Vietnam | 46,40 | 412.350 | 8.964 | Grade I urban area: 2011 City: 1921 Chinh District: 20 wards and 5 communes |
| 38 | Nha Trang | Khanh Hoa South Central Vietnam | 251,00 | 535.000 | 2.131 | Grade I cities: 2009 City: 1977 Chinh District: 19 wards, 8 communes |
| 39 | Ninh Binh
| Ninh Binh Plain Northern Vietnam | 48,36 | 160.166 | 3.336 | Grade II cities: 2014 City: 2007 Chinh District: 11 wards, 3 communes |
| 40 | Phan Rang – Thap Cham
| Ninh Thuan South Central Vietnam | 79,00 | 172.304 | 2.181 | Grade II cities: 2015 City: 2007 Chinh District: 15 wards, 1 commune |
| 41 | Phan Thiet | Binh Thuan South Central Vietnam | 206,45 | 276.255 | 1.341 | Grade II cities: 2009 City: 1999 Chinh District: 14 wards, 4 communes |
| 42 | Phu Ly | Henan Plain Northern Vietnam | 87,87 | 139.786 | 1.606 | Grade II urban area: 2018 City: 2008 Chinh District: 11 wards, 10 communes |
| 43 | Phuc Yen | Vinh Phuc Plain Northern Vietnam | 120,13 | 155.500 | 1.295 | Grade III urban area: 2013 City: 2018 Administrative units: 8 wards, 2 communes |
| 44 | Pleiku | Gia Lai Central Highlands | 266,62 | 250.972 | 943 | Grade II cities: 2009 City: 1999 Chinh District: 14 wards, 9 communes |
| 45 | Quang Ngai | Quang Ngai South Central Vietnam | 160,15 | 263.440 | 1.646 | Grade II cities: 2015 City: 2005 Chinh District: 14 wards, 9 communes |
| 46 | Quy Nhon | Binh Dinh South Central Vietnam | 285,00 | 455.000 | 1.596 | Grade I urban area: 2010 Town; 1986 Chinh District: 16 wards, 5 communes |
| 47 | Rach Gia | Kien Giang Southwest | 105,00 | 403.120 | 3.839 | Grade II cities: 2014 City: 2005 Chinh District: 11 wards, 1 commune |
| 48 | Sa Dec
| Dong Thap Southwest | 60,00 | 213.610 | 3.560 | Grade II urban area: 2018 City: 2013 Chinh District: 6 wards, 3 communes |
| 49 | Sam Son | Thanh Hoa North Central Vietnam | 45,00 | 150.902 | 3.353 | Grade III urban area: 2012 City: 2017 Chinh District: 8 wards, 3 communes |
| 50 | Soc Trang | Soc Trang Southwest | 76,15 | 221.430 | 2.913 | Grade III cities: 2005 City: 2007 Main District: 10 wards |
| 51 | Son La | Son La Northwest | 324,93 | 107.480 | 330 | Grade III cities: 2005 City: 2008 Chinh District: 7 wards, 5 communes |
| 52 | Song Cong | Thai Nguyen Northeast | 98,37 | 110.000 | 1.122 | Grade III urban area: 2010 City: 2015 Chinh District: 7 wards, 4 communes |
| 53 | Tam Diep | Ninh Binh Plain Northern Vietnam | 104,98 | 104.175 | 992 | Grade III urban area: 2012 City: 2015 Chinh District: 6 wards, 3 communes |
| 54 | Tam Ky | Quang Nam South Central Vietnam | 100,26 | 165.240 | 1.652 | Grade II Urban Area:2016 City: 2006 Chinh District: 9 wards, 4 communes |
| 55 | Tan An | Long An Southwest | 82,00 | 215.250 | 2.625 | Grade III cities: 2007 City: 2009 Chinh District: 9 wards, 5 communes |
| 56 | Tay Ninh
| Tay Ninh Southeast | 140,00 | 153.537 | 1.096 | Grade III urban area: 2012 City: 2013 Chinh District: 7 wards, 3 communes |
| 57 | Peace | Peace Plain Northern Vietnam | 68,00 | 268.167 | 3.943 | Grade II cities: 2013 City: 2004 Chinh District: 10 wards, 9 communes |
| 58 | Thai Nguyen
| Thai Nguyen Northeast | 223,00 | 420.000 | 1.883 | Type I Urbanization: 2010 City: 1962 Chinh District: 21 wards, 11 communes |
| 59 | Thanh Hoa | Thanh Hoa North Central Vietnam | 147,00 | 562.140 | 3.824 | Grade I urban area: 2014 City: 1994 Chinh District: 20 wards, 17 communes |
| 60 | Thu Dau Mot | Binh Duong Southeast | 118,67 | 385.000 | 3.262 | Grade I urban area: 2017 City: 2012 Chinh District: 14 wards |
| 61 | Tra Vinh | Tra Vinh Southwest | 68,00 | 160.310 | 2.357 | Grade II urban area: 2016 City: 2010 Main District: 9 wards, 1 commune |
| 62 | Tuy Hoa | Phu Yen South Central Vietnam | 107,00 | 202.030 | 1.888 | Grade II cities: 2013 City: 2005 Chinh District: 12 wards, 4 communes |
| 63 | Tuyen Quang | Tuyen Quang Northeast | 119,17 | 110.120 | 917 | Grade III cities: 2009 City: 2010 Chinh District: 7 wards, 6 communes |
| 64 | Uong Bi | Quang Ninh Northeast | 256,30 | 174.678 | 682 | Grade II cities: 2013 City: 2011 Chinh District: 9 wards, 2 communes |
| 65 | Vi Thanh | Hau Giang Southwest | 118,67 | 104.244 | 883 | Grade III cities: 2009 City: 2010 Chinh District: 5 wards, 4 communes |
| 66 | Viet Tri | Phu Tho Northeast | 111,75 | 315.280 | 2.840 | Grade I urban area: 2012 City: 1962 Chinh District: 13 wards, 10 communes |
| 67 | Glory | Nghe An North Central Vietnam | 105,10 | 545.180 | 5.201 | Grade I cities: 2008 City: 1963 Chinh District: 16 wards, 9 communes |
| 68 | Vinh Long | Vinh Long Southwest | 48,01 | 200.120 | 4.169 | Grade III cities: 2007 City: 2009 Chinh District: 7 wards, 4 communes |
| 69 | Vinh Yen | Vinh Phuc Plain Red River | 50,80 | 175.000 | 3.431 | Grade II cities: 2014 City: 2006 Chinh District: 7 wards, 2 communes |
| 70 | Vung Tau | Ba Ria Vung Tau Southeast | 150,40 | 527.025 | 3.513 | Grade I urban area: 2013 City: 1991 Chinh District: 16 wards, 1 commune |
| 71 | Yen Bai | Yen Bai Northwest | 108,15 | 99.850 | 924 | Grade III urban area 2001 City: 2002 Chinh District: 9 wards, 8 communes |
| 72 | Thuan An | Binh Duong Southeast | 83,71 | 603.000 | 7.394 | III 2017 |
| 73 | Di An | Binh Duong Southeast | 60,10 | 415.350 | 7.711 | III 2017 |
| 74 | Phu Quoc | Kien Giang Mekong Delta | 589,23 | 144.460 | 245 | II 2014 |
| 75 | Crossroads | Hau Giang Mekong Delta | 78,07 | 101.192 | 1.296 | III 2015 |
| 76 | Long Khanh | Dong Nai Southeast | 191,75 | 245.040 | 893 | III 2015 |
| 77 | Hongwu | Dong Thap Mekong Delta | 121,84 | 101.155 | 826 | III 2018 |
| 78 | Gia Nghia | Dak Nong Central Highlands | 284,11 | 61.413 | 222 | III 2015 |
How many cities are there in Vietnam?
| Rank | City Name | Area | Population | Density |
| 1 | Hanoi | 3,359 km² | 8.418 million people | 2,398 inhabitants/km² |
| 2 | Ho Chi Minh City. HCM | 2,096 km² | 8.993 million people | 4,363 inhabitants/km² |
| 3 | Hai Phong | 1,527 km² | 2.029 million people | 1,176 inhabitants/km² |
| 4 | Can Tho | 1,409 km² | 1.282 million people | 885 inhabitants/km² |
| 5 | Danang | 1,285 km² | 1.134 million people | 883 inhabitants/km² |
| 6 | Bien Hoa | 264.1 km² | 1.251 million people | 4,645 inhabitants/km² |
| 7 | Hai Duong | 111.64 km² | 509,252 people | 4562 inhabitants/km² |
| 8 | Hue | 70.76 km² | 470,251 people | 6646 inhabitants/km² |
| 9 | Thuan An | 83.71 km² | 508,433 people | 6074 inhabitants/km² |
| 10 | Thu Duc | 211.56 km² | 1.013 million people | 4792 inhabitants/km² |
Which is the smallest province in Vietnam?
Which province is the largest in the South?
Which province is the largest in the North?
Which province is the largest in the West?
Which province is the largest in the Central Highlands?
Which province has the longest coastline?
Which island has the largest area in Vietnam?
Which city is the largest city in Vietnam today?
Which city is the capital of Vietnam?
Which city is an important industrial center and seaport in Vietnam?
What is Vietnam’s population ranked in the world?
According to estimates by the U.S. Census Bureau, as of September 2022, the worldwide population reached 7,922,312,800 people and is forecast to reach 8 billion by mid-November 2022. Compared to 7.2 billion people in 2015, the world’s population has increased significantly, with a growth rate of about 140 people per minute.
Despite this, the world’s population growth rate has been slowing down in recent decades. This slowdown is expected to continue until the population growth rate is balanced at zero (equal birth and death rates) around 2080-2100. At that time, the world’s population is forecast to stabilize at about 10.4 billion people.
The current population of Vietnam is 99,097,162 people as of November 14, 2023 according to data from Worldometers. Vietnam’s population currently accounts for 1.23% of the world’s population. Vietnam is ranked 16th in the world in the population ranking of countries and territories. The population density of Vietnam is 319 people/km2. With a total land area of 310,070 km2. (Source: Worldometers live update on 14/11/2023)
According to VNPOLYFIBER, the total world population in 2023 is 8,072,806,135 people (updated on October 14, 2023).
The top 3 countries with the largest populations in the world are China, India and the United States.
Details of the population table of countries/territories in the world (Source: Worldometers updated directly on 14/11/2023)
| STT | Country Name | Population (2023) | Yearly Changes | Population density (people/km2) | Area (km2) | Migration | % of the world |
| 1 | India | 1.428.627.663 | 0,81 % | 481 | 2.973.190 | -486,136 | 17,76 % |
| 2 | China | 1.425.671.352 | -0,02 % | 152 | 9.388.211 | -310,22 | 17,72 % |
| 3 | United States | 339.996.563 | 0,50 % | 37 | 9.147.420 | 999.700 | 4,23 % |
| 4 | Indonesia | 277.534.122 | 0,74 % | 153 | 1.811.570 | -49,997 | 3,45 % |
| 5 | Pakistan | 240,485,658 | 1,98 % | 312 | 770.880 | -165.988 | 2,99 % |
| 6 | Nigeria | 223.804.632 | 2,41 % | 246 | 910.770 | -59.996 | 2,78 % |
| 7 | Brazil | 216.422.446 | 0,52 % | 26 | 8.358.140 | 6.000 | 2,69 % |
| 8 | Bangladesh | 172.954.319 | 1,03 % | 1.329 | 130.170 | -309,977 | 2,15 % |
| 9 | Russia | 144.444.359 | -0,19 % | 9 | 16.376.870 | -136,414 | 1,80 % |
| 10 | Mexico | 128.455.567 | 0,75 % | 66 | 1.943.950 | -50,239 | 1,60 % |
| 11 | Ethiopia | 126.527.060 | 2,55 % | 127 | 1.000.000 | -11.999 | 1,57 % |
| 12 | Japan | 123.294.513 | -0,53 % | 338 | 364.555 | 99.994 | 1,53 % |
| 13 | Philippines | 117.337.368 | 1,54 % | 394 | 298.170 | -69.996 | 1,46 % |
| 14 | Egypt | 112.716.598 | 1,56 % | 113 | 995.450 | -29.998 | 1,40 % |
| 15 | Democratic Republic of the Congo | 102.262.808 | 3,29 % | 45 | 2.267.050 | -14.999 | 1,27 % |
| 16 | Vietnam | 98.858.950 | 0,68 % | 319 | 310.070 | -82.700 | 1,23 % |
| 17 | Iran | 89.172.767 | 0,70 % | 55 | 1.628.550 | -39.998 | 1,11 % |
| 18 | Turkey | 85.816.199 | 0,56 % | 112 | 769.630 | -318.067 | 1,07 % |
| 19 | Germany | 83.294.633 | -0,09 % | 239 | 348.560 | 155.751 | 1,04 % |
| 20 | Thailand | 71.801.279 | 0,15 % | 141 | 510.890 | 18.999 | 0,89 % |
| 21 | United Kingdom | 67.736.802 | 0,34 % | 280 | 241.930 | 165.790 | 0,84 % |
| 22 | Tanzania | 67.438.106 | 2,96 % | 76 | 885.800 | -39.997 | 0,84 % |
| 23 | France | 64.756.584 | 0,20 % | 118 | 547.557 | 67.761 | 0,80 % |
| 24 | South Africa | 60.414.495 | 0,87 % | 50 | 1.213.090 | 58.496 | 0,75 % |
| 25 | Italy | 58.870.762 | -0,28 % | 200 | 294.140 | 58.496 | 0,73 % |
| 26 | Kenya | 55.100.586 | 1,99 % | 97 | 569.140 | -10.000 | 0,68 % |
| 27 | Myanmar | 54.577.997 | 0,74 % | 84 | 653.290 | -34,998 | 0,68 % |
| 28 | Colombia | 52.085.168 | 0,41 % | 47 | 1.109.500 | -175.051 | 0,65 % |
| 29 | South Korea | 51.784.059 | -0,06 % | 533 | 97.230 | 29.998 | 0,64 % |
| 30 | Uganda | 48.582.334 | 2,82 % | 243 | 199.810 | -126,181 | 0,60 % |
| 31 | Sudan | 48.109.006 | 2,63 % | 27 | 1.765.048 | -9,999 | 0,60 % |
| 32 | Spain | 47.519.628 | -0,08 % | 95 | 498.800 | 39.998 | 0,59 % |
| 33 | Argentina | 45.773.884 | 0,58 % | 17 | 2.736.690 | 3.718 | 0,57 % |
| 34 | Algeria | 45.606.480 | 1,57 % | 19 | 2.381.740 | -9,999 | 0,57 % |
| 35 | Iraq | 45.504.560 | 2,27 % | 105 | 434.320 | -6.000 | 0,57 % |
| 36 | Afghanistan | 42.239.854 | 2,70 % | 65 | 652.860 | -65,846 | 0,53 % |
| 37 | Poland | 41.026.067 | 2,93 % | 134 | 306.230 | -910,475 | 0,51 % |
| 38 | Canada | 38.781.291 | 0,85% | 4 | 9.093.510 | 249.746 | 0,48 % |
| 39 | Moroccan | 37.840.044 | 1,02 % | 85 | 446.300 | -39.998 | 0,47 % |
| 40 | Saudi Arabia | 36.947.025 | 1,48 % | 17 | 2.149.690 | 28.998 | 0,46 % |
| 41 | Ukraine | 36.744.634 | -7,45 % | 63 | 579.320 | 1.784.718 | 0,46 % |
| 42 | Angola | 36.684.202 | 3,08 % | 29 | 1.246.700 | -1.000 | 0,46 % |
| 43 | Uzbekistan | 35.163.944 | 1,55 % | 83 | 425.400 | -19.999 | 0,44 % |
| 44 | Yemen | 34.449.825 | 2,24 % | 65 | 527.970 | -29,914 | 0,43 % |
| 45 | Peru | 34.352.719 | 0,89 % | 27 | 1.280.000 | -61,442 | 0,43 % |
| 46 | Malaysia | 34.308.525 | 1,09 % | 104 | 328.550 | 48.997 | 0,43 % |
| 47 | Ghana | 34.121.985 | 1,93 % | 150 | 227.540 | -9,999 | 0,42 % |
| 48 | Mozambique | 33.897.354 | 2,81 % | 43 | 786.380 | -5.000 | 0,42 % |
| 49 | Nepal | 30.896.590 | 1,14 % | 216 | 143.350 | -62.012 | 0,38 % |
| 50 | Madagascar | 30.325.732 | 2,41 % | 52 | 581.795 | -1.500 | 0,38 % |
| 51 | Côte d’Ivoire | 28.873.034 | 2,53 % | 91 | 318.000 | 6.000 | 0,36 % |
| 52 | Venezuela | 28.838.499 | 1,90 % | 33 | 882.050 | 321.106 | 0,36 % |
| 53 | Camourun | 28.647.293 | 2,63 % | 61 | 472.710 | -4,8 | 0,36 % |
| 54 | Niger | 27.202.843 | 3,80 % | 21 | 1.266.700 | 1.000 | 0,34 % |
| 55 | Australia | 26.439.111 | 1,00 % | 3 | 7.682.300 | 139.991 | 0,33 % |
| 56 | North Korea | 26.160.821 | 0,35 % | 217 | 120.410 | -2.000 | 0,33 % |
| 57 | Taiwan | 23.923.276 | 0,13 % | 676 | 35.410 | 23.999 | 0,30% |
| 58 | Mali | 23.293.698 | 3,10% | 19 | 1.220.190 | -39.998 | 0,29 % |
| 59 | Burkina Faso | 23.251.485 | 2,55 % | 85 | 273.600 | -24.998 | 0,29 % |
| 60 | Syria | 23.227.014 | 4,98 % | 126 | 183.630 | 757,103 | 0,29 % |
| 61 | Sri Lanka | 21.893.579 | 0,28 % | 349 | 62.710 | -77,495 | 0,27 % |
| 62 | Malawi | 20.931.751 | 2,58 % | 222 | 94.280 | -6.000 | 0,26 % |
| 63 | Zambia | 20.569.737 | 2,76 % | 28 | 743.390 | -5.000 | 0,26 % |
| 64 | Romania | 19.892.812 | 1,19 % | 86 | 230.170 | -254,616 | 0,25 % |
| 65 | Chilean | 19.629.590 | 0,13 % | 26 | 743.532 | -71,205 | 0,24 % |
| 66 | Kazakhstan | 19.606.633 | 1,08 % | 7 | 2.699.700 | 0 | 0,24 % |
| 67 | Chad | 18.278.568 | 3,13 % | 15 | 1.259.200 | -2.000 | 0,23 % |
| 68 | Ecuador | 18.190.484 | 1,05 % | 73 | 248.360 | -21.525 | 0,23 % |
| 69 | Somali | 18.143.378 | 3,10% | 29 | 627.340 | -30.000 | 0,23 % |
| 70 | Guatemala | 18.092.026 | 1,39 % | 169 | 107.160 | -9,11 | 0,22 % |
| 71 | Senegal | 17.763.163 | 2,58 % | 92 | 192.530 | -19.999 | 0,22 % |
| 72 | Netherlands | 17.618.299 | 0,31 % | 522 | 33.720 | 29.998 | 0,22 % |
| 73 | Cambodia | 16.944.826 | 1,06 % | 96 | 176.520 | -29.998 | 0,21 % |
| 74 | Zimbabwe | 16.665.409 | 2,11 % | 43 | 386.850 | -9,999 | 0,21 % |
| 75 | Ginay | 14.190.612 | 2,39 % | 58 | 245.720 | -4.000 | 0,18 % |
| 76 | Rwanda | 14.094.683 | 2,31 % | 571 | 24.670 | -8,999 | 0,18 % |
| 77 | Benin | 13.712.828 | 2,70 % | 122 | 112.760 | -200 | 0,17 % |
| 78 | Burundi | 13.238.559 | 2,71 % | 516 | 25.680 | 2.000 | 0,16 % |
| 79 | Tunisia | 12.458.223 | 0,83 % | 80 | 155.360 | -4.000 | 0,15 % |
| 80 | Bolivia | 12.388.571 | 1,35 % | 11 | 1.083.300 | -3.000 | 0,15 % |
| 81 | Haiti | 11.724.763 | 1,21 % | 425 | 27.560 | -31.811 | 0,15 % |
| 82 | Belgium | 11.686.140 | 0,26 % | 386 | 30.280 | 23.999 | 0,15 % |
| 83 | Jordan | 11.337.052 | 0,45 % | 128 | 88.780 | -157,392 | 0,14 % |
| 84 | Dominican Republic | 11.332.972 | 0,93 % | 235 | 48.320 | -29.099 | 0,14 % |
| 85 | Cuba | 11.194.449 | -0,16 % | 105 | 106.440 | -6.000 | 0,14 % |
| 86 | South Sudan | 11.088.796 | 1,61 % | 18 | 610.952 | -23,291 | 0,14 % |
| 87 | Sweden | 10.612.086 | 0,59 % | 26 | 410.340 | 39.998 | 0,13 % |
| 88 | Honduras | 10.593.798 | 1,54 % | 95 | 111.890 | -5,034 | 0,13 % |
| 89 | Czech Republic (Czech Republic) | 10.495.295 | 0,01 % | 136 | 77.240 | 22.011 | 0,13 % |
| 90 | Azerbaijan | 10.412.651 | 0,53 % | 126 | 82.658 | 0 | 0,13 % |
| 91 | Greece | 10.341.277 | -0,42 % | 80 | 128.900 | 5.000 | 0,13 % |
| 92 | Papua New Guinea | 10.329.931 | 1,85 % | 23 | 452.860 | -800 | 0,13 % |
| 93 | Portugal | 10.247.605 | -0,23 % | 112 | 91.590 | 9.999 | 0,13 % |
| 94 | Hungary | 10.156.239 | 1,90 % | 112 | 90.530 | -156,677 | 0,13 % |
| 95 | Tajikistan | 10.143.543 | 1,92 % | 72 | 139.960 | -19.999 | 0,13 % |
| 96 | United Arab Emirates | 9.516.871 | 0,80 % | 114 | 83.600 | 0 | 0,12 % |
| 97 | Belarus | 9.498.238 | -0,39 % | 47 | 202.910 | -4,282 | 0,12 % |
| 98 | Israelis | 9.174.520 | 1,51 % | 424 | 21.640 | 9.999 | 0,11 % |
| 99 | Walk | 9.053.799 | 2,32 % | 166 | 54.390 | -2.000 | 0,11 % |
| 100 | Clothing | 8.958.960 | 0,22 % | 109 | 82,409 | 19.999 | 0,11 % |
| 101 | Switzerland | 8.796.669 | 0,64 % | 223 | 39.516 | 39.998 | 0,11 % |
| 102 | Sierra Leone | 8.791.092 | 2,15 % | 122 | 72.180 | -4.000 | 0,11 % |
| 103 | Laos | 7.633.779 | 1,39 % | 33 | 230.800 | -9,999 | 0,09 % |
| 104 | Hong Kong | 7.491.609 | 0,04 % | 7.135 | 1.050 | 19.999 | 0,09 % |
| 105 | Serbia | 7.149.077 | -1,00 % | 82 | 87.460 | -9,999 | 0,09 % |
| 106 | Nicaragua | 7.046.310 | 1,41 % | 59 | 120.340 | -8.000 | 0,09 % |
| 107 | Libya | 6.888.388 | 1,12 % | 4 | 1.759.540 | -2.000 | 0,09 % |
| 108 | Paraguay | 6.861.524 | 1,19 % | 17 | 397.300 | -12,499 | 0,09 % |
| 109 | Kyrgyzstan | 6.735.347 | 1,58 % | 35 | 191.800 | -9,999 | 0,08 % |
| 110 | Bulgaria | 6.687.717 | -1,39 % | 62 | 108.560 | -4,8 | 0,08 % |
| 111 | Turkmenistan | 6.516.100 | 1,33 % | 14 | 469.930 | -4.000 | 0,08 % |
| 112 | El Salvador | 6.364.943 | 0,45 % | 307 | 20.720 | -23,249 | 0,08 % |
| 113 | Congo | 6.106.869 | 2,29 % | 18 | 341.500 | -1.000 | 0,08 % |
| 114 | Singapore | 6.014.723 | 0,65 % | 8,592 | 700 | 26.998 | 0,07 % |
| 115 | Denmark | 5.910.913 | 0,49 % | 139 | 42.430 | 19.999 | 0,07 % |
| 116 | Slovakia | 5.795.199 | 2,69 % | 121 | 48.088 | -112.067 | 0,07 % |
| 117 | Central African Republic | 5.742.315 | 2,92 % | 9 | 622.980 | -14,716 | 0,07 % |
| 118 | Finland | 5.545.475 | 0,09 % | 18 | 303.890 | 13.999 | 0,07 % |
| 119 | Norway | 5.474.360 | 0,74 % | 15 | 365.268 | 27.998 | 0,07 % |
| 120 | Liberia | 5.418.377 | 2,18 % | 56 | 96.320 | -5.000 | 0,07 % |
| 121 | State of Palestine | 5.371.230 | 2,31 % | 892 | 6.020 | -5.000 | 0,07 % |
| 122 | Lebanon | 5.353.930 | -2,47 % | 523 | 10.230 | -177,331 | 0,07 % |
| 123 | New Zealand | 5.228.100 | 0,83 % | 20 | 263.310 | 12.999 | 0,06 % |
| 124 | Costa Rica | 5.212.173 | 0,60 % | 102 | 51.060 | 3.750 | 0,06 % |
| 125 | Ireland | 5.056.935 | 0,67 % | 73 | 68.890 | 9.999 | 0,06 % |
| 126 | Mauritania | 4.862.989 | 2,68 % | 5 | 1.030.700 | 3.000 | 0,06 % |
| 127 | Oman | 4.644.384 | 1,49 % | 15 | 309.500 | 0 | 0,06 % |
| 128 | Panama | 4.468.087 | 1,35 % | 60 | 74.340 | 7.262 | 0,06 % |
| 129 | Kuwait | 4.310.108 | 0,97 % | 242 | 17.820 | 11.999 | 0,05 % |
| 130 | Croatia | 4.008.617 | -0,54 % | 72 | 55.960 | -2.000 | 0,05 % |
| 131 | Eritrea | 3.748.901 | 1,76 % | 37 | 101.000 | -15,297 | 0,05 % |
| 132 | Georgia | 3.728.282 | -0,43 % | 54 | 69.490 | -9,999 | 0,05 % |
| 133 | Mongolia | 3.447.157 | 1,44 % | 2 | 1.553.560 | -850 | 0,04 % |
| 134 | Moldova | 3.435.931 | 4,98 % | 105 | 32.850 | -125,204 | 0,04 % |
| 135 | Uruguay | 3.423.108 | 0,01 % | 20 | 175.020 | -1.500 | 0,04 % |
| 136 | Puerto Rico | 3.260.314 | 0,24 % | 368 | 8,87 | 19.835 | 0,04 % |
| 137 | Bosnia and Herzegovina | 3.210.847 | -0,70 % | 63 | 51.000 | -500 | 0,04 % |
| 138 | Albania | 2.832.439 | -0,35 % | 103 | 27.400 | -8.000 | 0,04 % |
| 139 | Jamaica | 2.825.544 | -0,06 % | 261 | 10.830 | -10.999 | 0,04 % |
| 140 | Armenia | 2.777.970 | -0,09 % | 98 | 28.470 | -5.000 | 0,03 % |
| 141 | Gambia | 2.773.168 | 2,48 % | 274 | 10.120 | -3.000 | 0,03 % |
| 142 | Lithuania | 2.718.352 | -1,15 % | 43 | 62.674 | -13,128 | 0,03 % |
| 143 | Qatar | 2.716.391 | 0,79 % | 234 | 11.610 | 0 | 0,03 % |
| 144 | Botswana | 2.675.352 | 1,71 % | 5 | 566.730 | 3.000 | 0,03 % |
| 145 | Namibia | 2.604.172 | 1,45 % | 3 | 823.290 | -3,916 | 0,03 % |
| 146 | Gabon | 2.436.566 | 1,99 % | 9 | 257.670 | 1.000 | 0,03 % |
| 147 | Lesotho | 2.330.318 | 1,06 % | 77 | 30.360 | -4.000 | 0,03 % |
| 148 | Guinea-Bissau | 2.150.842 | 2,15 % | 76 | 28.120 | -1.400 | 0,03 % |
| 149 | Slovenia | 2.119.675 | -0,01 % | 105 | 20.140 | 2.000 | 0,03 % |
| 150 | North Macedonia | 2.085.679 | -0,38 % | 83 | 25.220 | -1.000 | 0,03 % |
| 151 | Latvia | 1.830.211 | -1,10 % | 29 | 62.200 | -7.630 | 0,02 % |
| 152 | Equatorial Guinea | 1.714.671 | 2,37 % | 61 | 28.050 | 4.000 | 0,02 % |
| 153 | Trinidad and Tobago | 1.534.937 | 0,25 % | 299 | 5.130 | -800 | 0,02 % |
| 154 | Bahrain | 1.485.509 | 0,90 % | 1.955 | 760 | 0 | 0,02 % |
| 155 | Timor-Leste | 1.360.596 | 1,44 % | 91 | 14.870 | -5.000 | 0,02 % |
| 156 | Estonia | 1.322.765 | -0,25 % | 31 | 42.390 | -1.000 | 0,02 % |
| 157 | Mosaic | 1.300.557 | 0,08 % | 641 | 2.030 | 0 | 0,02 % |
| 158 | Cyprus | 1.260.138 | 0,69 % | 136 | 9.240 | 5.000 | 0,02 % |
| 159 | Eswatini | 1.210.822 | 0,76 % | 70 | 17.200 | -5,268 | 0,02 % |
| 160 | Djibouti | 1.136.455 | 1,39 % | 49 | 23.180 | 900 | 0,01 % |
| 161 | Reunite | 981.796 | 0,80 % | 393 | 2.500 | -630 | 0,01 % |
| 162 | Fiji | 936.375 | 0,71 % | 51 | 18.270 | -3,289 | 0,01 % |
| 163 | Comoros | 852.075 | 1,83 % | 458 | 1,861 | -2.000 | 0,01 % |
| 164 | Guyana | 813.834 | 0,63 % | 4 | 196.850 | -3,9 | 0,01 % |
| 165 | Bhutan | 787.424 | 0,64 % | 21 | 38.117 | 300 | 0,01 % |
| 166 | Solomon Islands | 740.424 | 2,23 % | 26 | 27.990 | -1.600 | 0,01 % |
| 167 | Macao | 704.149 | 1,29 % | 23,472 | 30 | 5.000 | 0,01 % |
| 168 | Luxembourg | 654.768 | 1,11 % | 253 | 2.590 | 4,883 | 0,01 % |
| 169 | Montenegro | 626.485 | -0,10 % | 47 | 13.450 | -480 | 0,01 % |
| 170 | Suriname | 623.236 | 0,84 % | 4 | 156.000 | -1.000 | 0,01 % |
| 171 | Cape Verde | 598.682 | 0,93 % | 149 | 4.030 | -1,227 | 0,01 % |
| 172 | Western Sahara | 587.259 | 1,96 % | 2 | 266.000 | 5.600 | 0,01 % |
| 173 | Micronesia | 544.321 | 0,98 % | 778 | 700 | -1,642 | 0,01 % |
| 174 | Malta | 535.064 | 0,33 % | 1.672 | 320 | 850 | 0,01 % |
| 175 | Maldives | 521.021 | -0,53 % | 1.737 | 300 | -8,652 | 0,01 % |
| 176 | Brunei | 452.524 | 0,78 % | 86 | 5.270 | 0 | 0,01 % |
| 177 | Bahamas | 412.623 | 0,64 % | 41 | 10.010 | 1.000 | 0,01 % |
| 178 | Belize | 410.825 | 1,37 % | 18 | 22.810 | 600 | 0,01 % |
| 179 | Guadeloupe | 395.839 | 0,02 % | 234 | 1.690 | -800 | 0,00% |
| 180 | Nước Iceland | 375.318 | 0,65 % | 4 | 100.250 | 380 | 0,00% |
| 181 | Martinique | 366.981 | -0,14 % | 346 | 1.060 | -650 | 0,00% |
| 182 | Mayotte | 335.995 | 3,03 % | 896 | 375 | 0 | 0,00% |
| 183 | Vanuatu | 334.506 | 2,38 % | 27 | 12.190 | 0 | 0,00% |
| 184 | French Guiana | 312.155 | 2,49 % | 4 | 82.200 | 1.200 | 0,00% |
| 185 | French Polynesia | 308.872 | 0,85% | 84 | 3.660 | -100 | 0,00% |
| 186 | New Caledonia | 292.991 | 1,05 % | 16 | 18.280 | 500 | 0,00% |
| 187 | Barbados | 281.995 | 0,13 % | 656 | 430 | -80 | 0,00% |
| 188 | Sao Tome & Principe | 231.856 | 1,97 % | 242 | 960 | -600 | 0,00% |
| 189 | Samoa | 225.681 | 1,48 % | 80 | 2.830 | -1.500 | 0,00% |
| 190 | Citrus | 192.077 | 0,48 % | 433 | 444 | 515 | 0,00% |
| 191 | Saint Lucia | 180.251 | 0,22 % | 295 | 610 | 0 | 0,00% |
| 192 | Guam | 172.952 | 0,69 % | 320 | 540 | -500 | 0,00% |
| 193 | Kiribati | 133.515 | 1,74 % | 165 | 810 | -400 | 0,00% |
| 194 | Grenada | 126.183 | 0,59 % | 371 | 340 | -200 | 0,00% |
| 195 | Tonga | 107.773 | 0,86 % | 150 | 720 | -800 | 0,00% |
| 196 | Seychelles | 107.660 | 0,51 % | 234 | 460 | -200 | 0,00% |
| 197 | Aruba | 106.277 | -0,16 % | 590 | 180 | 157 | 0,00% |
| 198 | Saint Vincent & the Grenadines | 103.698 | -0,24 % | 266 | 390 | -200 | 0,00% |
| 199 | U.S. Virgin Islands | 98.750 | -0,72 % | 282 | 350 | -450 | 0,00% |
| 200 | Antigua and Barbuda | 94.298 | 0,57 % | 214 | 440 | 0 | 0,00% |
| 201 | Isle of Man | 84.710 | 0,23 % | 149 | 570 | 340 | 0,00% |
| 202 | Andorra | 80.088 | 0,33 % | 170 | 470 | 200 | 0,00% |
| 203 | Dominica | 73.040 | 0,42 % | 97 | 750 | -40 | 0,00% |
| 204 | Cayman Islands | 69.310 | 0,88 % | 289 | 240 | 400 | 0,00% |
| 205 | Bermuda | 64.069 | -0,18 % | 1.281 | 50 | 0 | 0,00% |
| 206 | Greenland | 56.643 | 0,31 % | 0 | 410.450 | -100 | 0,00% |
| 207 | Faeroe Islands | 53.270 | 0,34 % | 38 | 1.396 | 0 | 0,00% |
| 208 | Northern Mariana Islands | 49.796 | 0,49 % | 108 | 460 | -50 | 0,00% |
| 209 | Saint Kitts & Nevis | 47.755 | 0,21 % | 184 | 260 | 20 | 0,00% |
| 210 | Turks and Caicos | 46.062 | 0,79 % | 48 | 950 | 200 | 0,00% |
| 211 | Sint Maarten | 44.222 | 0,11 % | 1.301 | 34 | 0 | 0,00% |
| 212 | American Samoa | 43.914 | -0,81 % | 220 | 200 | -790 | 0,00% |
| 213 | Marshall Island | 41.996 | 1,03 % | 233 | 180 | 0 | 0,00% |
| 214 | Liechtenstein | 39.584 | 0,65 % | 247 | 160 | 150 | 0,00% |
| 215 | Monaco | 36.297 | -0,47 % | 24.360 | 1 | 200 | 0,00% |
| 216 | San Marino | 33.642 | -0,05 % | 561 | 60 | 100 | 0,00% |
| 217 | Gibraltar | 32.688 | 0,12 % | 3.269 | 10 | -24 | 0,00% |
| 218 | Saint Martin | 32.077 | 0,90 % | 605 | 53 | 0 | 0,00% |
| 219 | British Virgin Islands | 31.538 | 0,74 % | 210 | 150 | 200 | 0,00% |
| 220 | Dutch Caribbean | 27.148 | 0,45 % | 83 | 328 | 100 | 0,00% |
| 221 | Palau | 18.058 | 0,02 % | 39 | 460 | -20 | 0,00% |
| 222 | Cook Islands | 17.044 | 0,19 % | 71 | 240 | -93 | 0,00% |
| 223 | Anguilla | 15.899 | 0,26 % | 177 | 90 | 0 | 0,00% |
| 224 | Nauru | 12.780 | 0,88 % | 639 | 20 | -140 | 0,00% |
| 225 | Wallis & Futuna | 11.502 | -0,60 % | 82 | 140 | -119 | 0,00% |
| 226 | Tuvalu | 11.396 | 0,74 % | 380 | 30 | -60 | 0,00% |
| 227 | Saint Barthelemy | 10.994 | 0,25 % | 524 | 21 | 0 | 0,00% |
| 228 | Saint Pierre & Miquelon | 5.840 | -0,38 % | 25 | 230 | 0 | 0,00% |
| 229 | Saint Helena | 5.314 | -1,12 % | 14 | 390 | 0 | 0,00% |
| 230 | Montserrat | 4.386 | -0,09 % | 44 | 100 | 0 | 0,00% |
| 231 | Falkland Islands | 3.791 | 0,29 % | 0 | 12.170 | 0 | 0,00% |
| 232 | Niue | 1.935 | 0,05 % | 7 | 260 | 0 | 0,00% |
| 233 | Tokelau | 1.893 | 1,18 % | 189 | 10 | 0 | 0,00% |
| 234 | Holy See | 518 | 1,57 % | 1.295 | 0 | 0 | 0,00% |

Area and Population of Districts in Ho Chi Minh City (2023)
Ho Chi Minh City, the largest city in Vietnam in terms of population and urbanization, serves as a key economic engine and an important cultural and educational center for the country. A common inquiry pertains to the current number of districts within Ho Chi Minh City and which areas have the largest and smallest land sizes.
Overview of Districts and Population in Ho Chi Minh City
Ho Chi Minh City, also referred to by its former name Saigon, is classified as a special centrally governed municipality of Vietnam, situated in the transition region between the Southeast and Southwest. The city is comprised of 16 districts and 1 suburban district, covering a total area of 2,095 km² (approximately 809 square miles).
Ho Chi Minh City is witnessing significant population growth. According to the latest estimates from the United Nations and the General Statistics Office of Vietnam, the population in 2023 is projected to be 9,320,866, a substantial increase from 1,213,224 in 1950. In the preceding year alone, the city experienced an increase of 243,708 residents, reflecting an annual growth rate of 2.68%.
The urbanization trends in Ho Chi Minh City indicate a concentration of population in both the urban core and surrounding suburban areas. Encompassing a vast area of 2,061.2 km² (approximately 795.3 square miles), the city faces various challenges and opportunities characteristic of a densely populated metropolis.
Population Density in Ho Chi Minh City
The population density in Ho Chi Minh City is approximately 4,097 individuals per km² (or 10,610 individuals per square mile). Representing 8.34% of the national population, Ho Chi Minh City ranks second in population size after Hanoi. The last census conducted in 2009 recorded a population of 7,521,130, while estimates in 2017 indicated a figure around 8,444,600.
Map of Districts in Ho Chi Minh City
Can Gio District, with an area of 704.22 km², is the largest district among the 24 districts of Ho Chi Minh City, significantly surpassing District 4. It is 2.8 times larger than Binh Chanh District, which has an area of 252.69 km², and approximately 15 times the size of Thu Duc District, which covers 47.7 km². In total, Ho Chi Minh City spans 2,095 km², with the five suburban districts encompassing more than three-quarters of the area at 1,601 km².
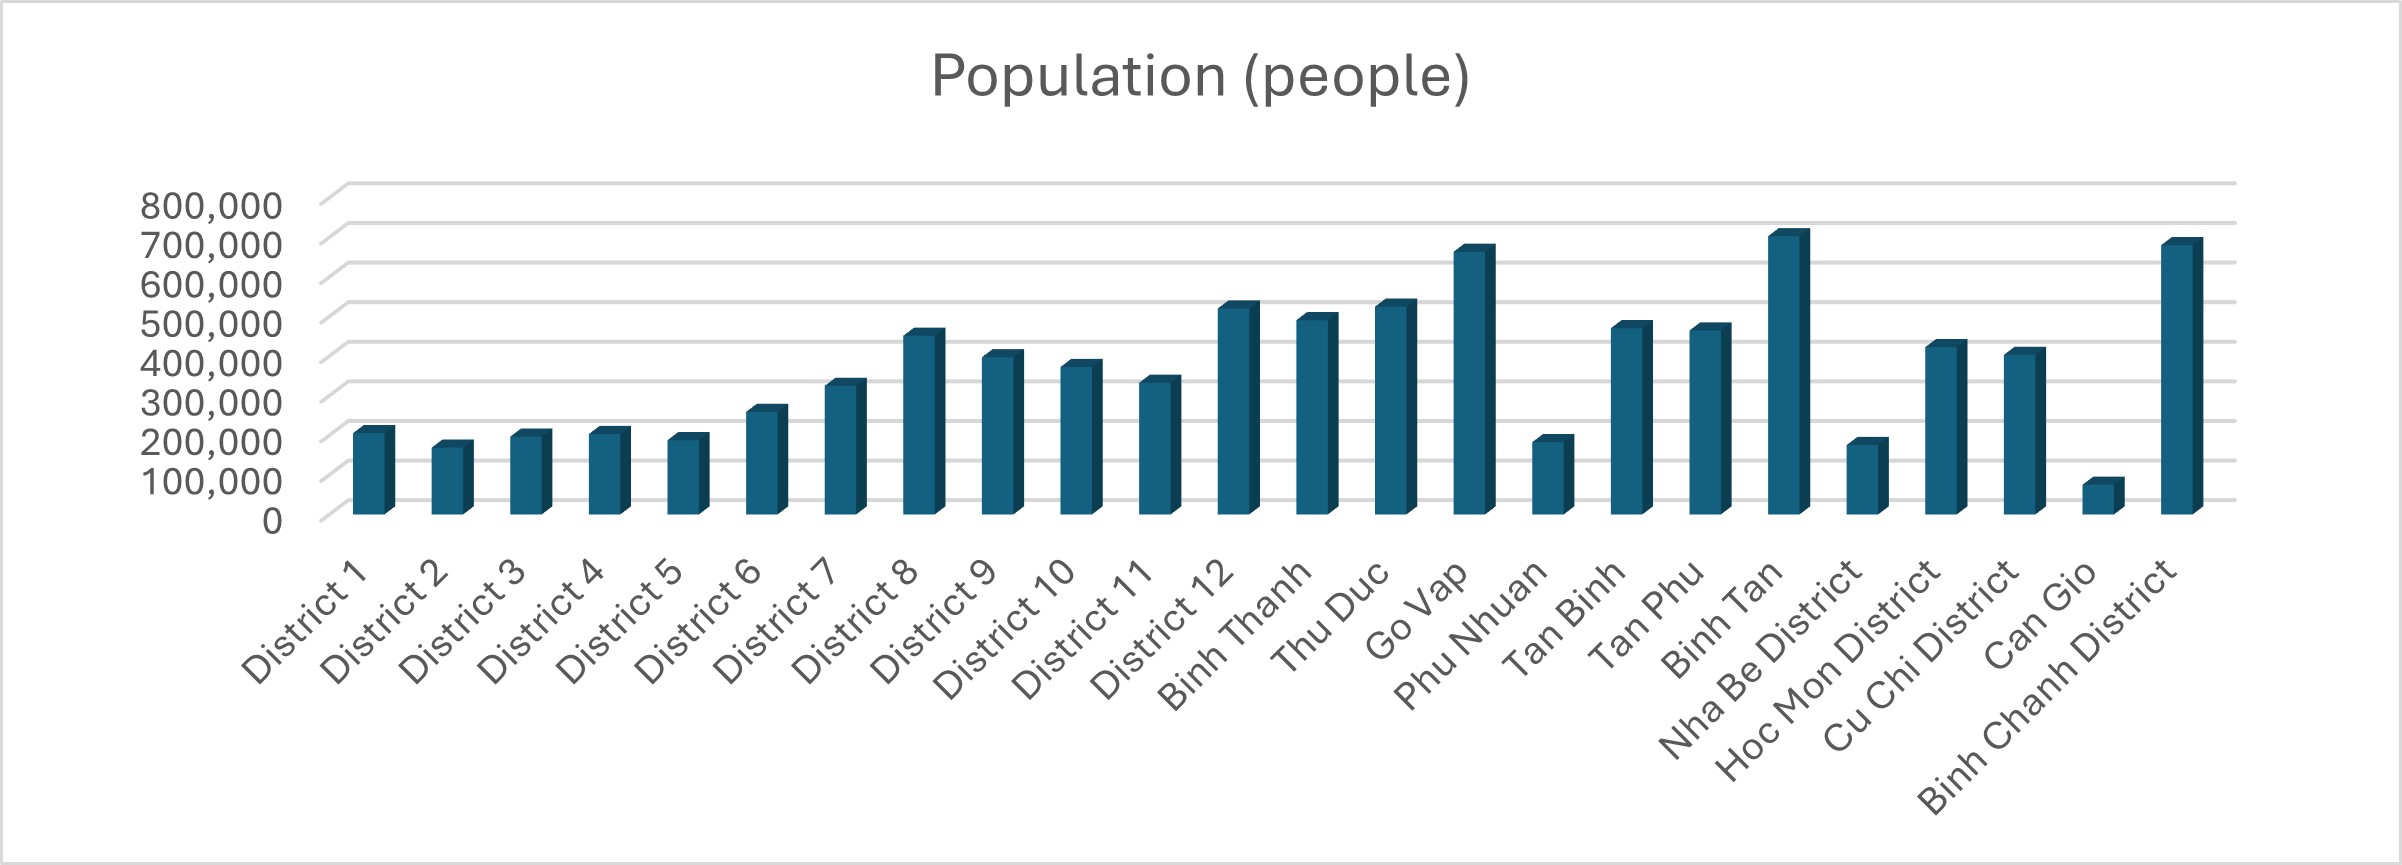
According to the latest statistical data from late 2020 and early 2021, Ho Chi Minh City has an estimated population density of 4,292 people per km². The city comprises 19 urban districts and 5 suburban districts, collectively covering a total area of 2,061 km². Additionally, statistics indicate the population distribution within the inner districts of Ho Chi Minh City across this overall area.
| County | Population (people) | Area (km²) | Population density (people/km²) | Number of wards/ communes |
| District 1 | 205,180 | 7.73 | 26,543 | 10 |
| District 2 | 168,680 | 49.74 | 3,391 | 11 |
| District 3 | 196,433 | 4.92 | 39,925 | 14 |
| District 4 | 203,060 | 4.18 | 48,578 | 15 |
| District 5 | 187,510 | 4.27 | 43,913 | 15 |
| District 6 | 258,945 | 7.19 | 36,014 | 14 |
| District 7 | 324,620 | 35.69 | 9,095 | 10 |
| District 8 | 451,290 | 19.18 | 23,529 | 18 |
| District 9 | 397,000 | 114 | 3,482 | 13 |
| District 10 | 372,450 | 5.72 | 65,113 | 15 |
| District 11 | 332,536 | 5.14 | 64,695 | 16 |
| District 12 | 520,175 | 52.78 | 9,855 | 11 |
| Binh Thanh | 490,618 | 20.76 | 23,632 | 20 |
| Thu Duc | 524,670 | 48 | 1,093 | 12 |
| Go Vap | 663,313 | 19.74 | 33,602 | 16 |
| Phu Nhuan | 182,477 | 4.88 | 37,392 | 15 |
| Tan Binh | 470,350 | 22.38 | 21,016 | 15 |
| Tan Phu | 464,493 | 16.06 | 28,922 | 11 |
| Binh Tan | 702,650 | 51.89 | 13,541 | 10 |
| Nha Be District | 175,360 | 100 | 1,753 | 7 |
| Hoc Mon District | 422,471 | 109 | 3,875 | 12 |
| Cu Chi District | 403,038 | 435 | 926 | 21 |
| Can Gio | 74,960 | 704 | 106 | 7 |
| Binh Chanh District | 680,000 | 253 | 2,688 | 16 |
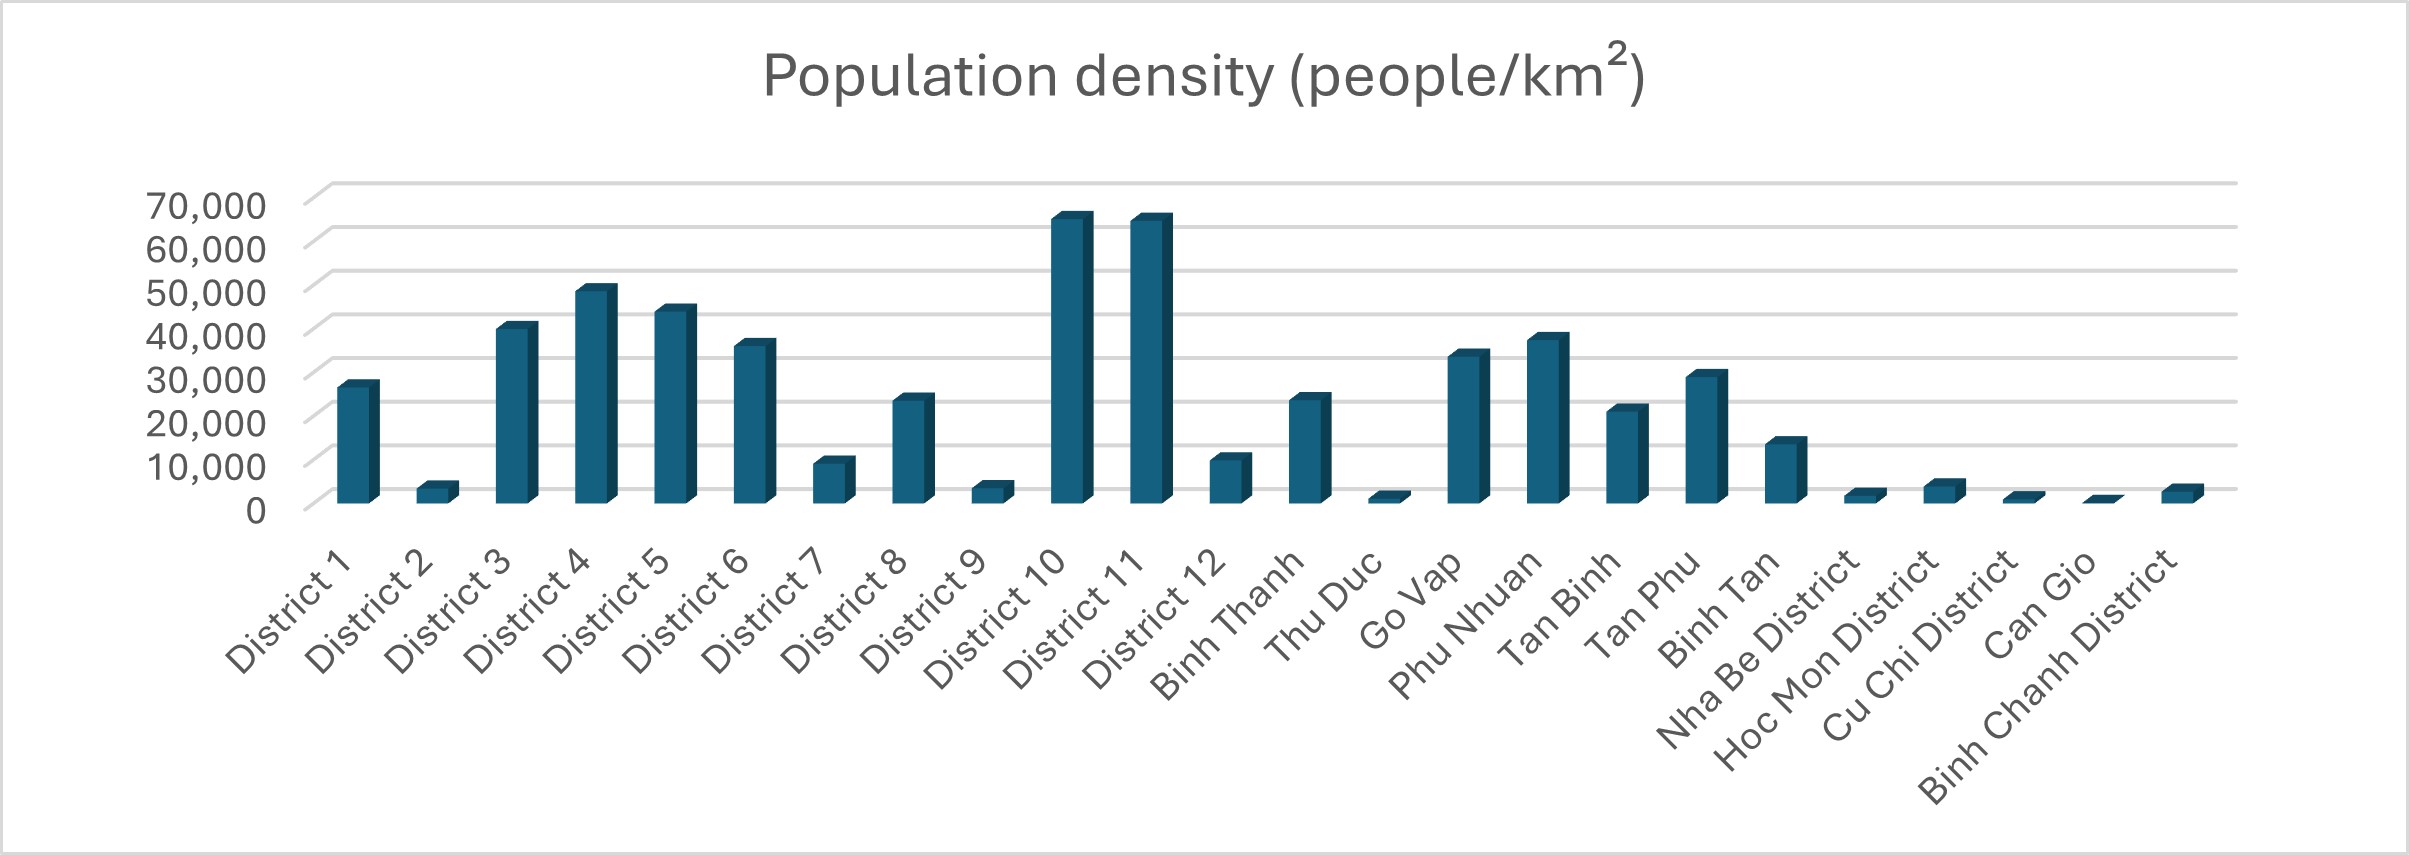
Which district in Ho Chi Minh City has the highest population density?
Which district in Ho Chi Minh City has the largest area?
Which district in Ho Chi Minh City has the largest population?
Which district in Ho Chi Minh City has the smallest area?
Ownership of Residential Property by Foreigners in Vietnam
Foreign individuals and organizations are permitted to own residential properties in Vietnam, with specific regulations governing ownership limits. According to current regulations, foreign entities are allowed to own a maximum of 30% of the apartments within each apartment building and no more than 30% of the total apartments across all buildings in a given area.
Recently, the Ministry of Construction issued an official letter to the General Department of Land Management under the Ministry of Natural Resources and Environment, providing guidance on the allowable number of apartments that foreign organizations and individuals can acquire in housing investment projects.
The Ministry referenced Article 161 of the Housing Law of 2014 and Decree No. 99, which detail provisions concerning foreign ownership of residential properties. Specifically, foreigners are restricted to owning no more than 30% of the apartments in any individual building and up to 10% of the detached houses within a project, capped at 250 units in areas with a population density equivalent to that of a ward-level administrative unit.
“The Housing Law does not specify the exact number of properties that an individual or organization can own. Therefore, it is recommended that the General Department of Land Management implement regulations based on the Housing Law,” stated the Ministry of Construction.
Foreigners can own residential properties for a defined term but do not have ownership rights to the land. Upon the expiration of this ownership period, foreigners may apply for a single extension and are permitted to buy and sell properties similarly to domestic citizens.
These are the latest provisions included by the Ministry of Construction in the Draft Law on Housing (Amended), following consultations with National Assembly deputies.
In a report addressing the feedback from the National Assembly deputies regarding the Draft Law, the Ministry acknowledged various significant concerns, particularly in relation to property ownership by foreign individuals and organizations. Some deputies suggested that the revised Housing Law should clarify that foreign ownership does not confer land use rights.
In response to these suggestions, the Ministry of Construction proposed to the Government a clarification of the regulations regarding property ownership by foreigners without associated land use rights, along with a provision allowing for a one-time extension of the ownership term.
Additionally, the Ministry recommended that regulations be established governing property ownership extensions for foreigners in Vietnam. Should foreigners purchase properties and later choose to sell to Vietnamese citizens or overseas Vietnamese, it is proposed that these buyers receive the same rights and obligations as domestic citizens.
Under the current Housing Law, eligible foreign ownership encompasses: foreign organizations and individuals investing in project-based housing construction in accordance with Vietnamese law; foreign-invested enterprises, branches, and representative offices; foreign investment funds; and foreign bank branches operating in Vietnam, as well as foreign individuals legally entering Vietnam.
The law stipulates that foreigners may acquire properties through one of the following means: investing in residential housing projects; purchasing, leasing, receiving as a gift, or inheriting commercial housing, including apartments and detached houses in housing investment projects, excluding areas designated for national defense and security.
Key Considerations for Foreigners Purchasing Property in Vietnam
- Eligibility Proof: Foreigners must demonstrate their eligibility to own property in Vietnam under the law. Documentation showing legal entry into Vietnam is required.
- Financial Transparency: To facilitate future fund withdrawal, foreigners should maintain a bank account in Vietnam, transferring funds from abroad for property transactions, while also retaining proof of income for purchasing.
- Project Ownership Knowledge: It is essential to research which projects permit foreign ownership to mitigate risks. Foreigners may only buy from newly developed residential projects rather than existing areas.
- Contractual Terms: When entering into purchasing agreements, foreigners should ensure the legal legitimacy of the contract with the investor to secure their rights.
- Understanding Local Practices: Recognize that the enforcement of contract terms may differ from practices in other countries, necessitating careful management of payments.
- Rights of Ownership: Foreign property owners retain full rights, such as leasing and inheriting, contingent on obtaining a house ownership certificate. Lease agreements must be registered, and tax obligations adhered to.
- Property Management: For foreigners not residing in Vietnam full-time, employing property management services can streamline compliance with local regulations.
Preferred Residential Areas for Foreigners in Ho Chi Minh City
According to the InterNations Expat City Ranking 2021, Ho Chi Minh City ranks third in Southeast Asia as a preferred destination for expatriates. Notable residential areas appealing to foreign residents include:
– Phu My Hung, District 7: Renowned for its international standards in infrastructure and planning, this area boasts a significant expatriate population, comprised of diverse nationalities including Korean, British, American, Taiwanese, and Japanese residents.
– District 1: Known for its vibrant cultural scene and business centers, District 1 attracts professionals seeking an active lifestyle amidst local culture.
– Thao Dien, District 2: As an emerging hub for expatriates, Thao Dien features luxury villas and apartments, international schools, and European restaurants, making it an attractive community for successful businesspeople and professionals.
– Thu Thiem New Urban Area, District 2: This area presents a blend of greenery and urban living, just minutes from the city center, boasting an array of amenities and infrastructure developments attracting foreign buyers.
These neighborhoods offer a combination of quality living environments, cultural engagement, and community amenities that cater to the needs of expatriates in Ho Chi Minh City.